29
/
en
AIzaSyAYiBZKx7MnpbEhh9jyipgxe19OcubqV5w
April 1, 2024
242954
Slovenia
SVN
true
2
1
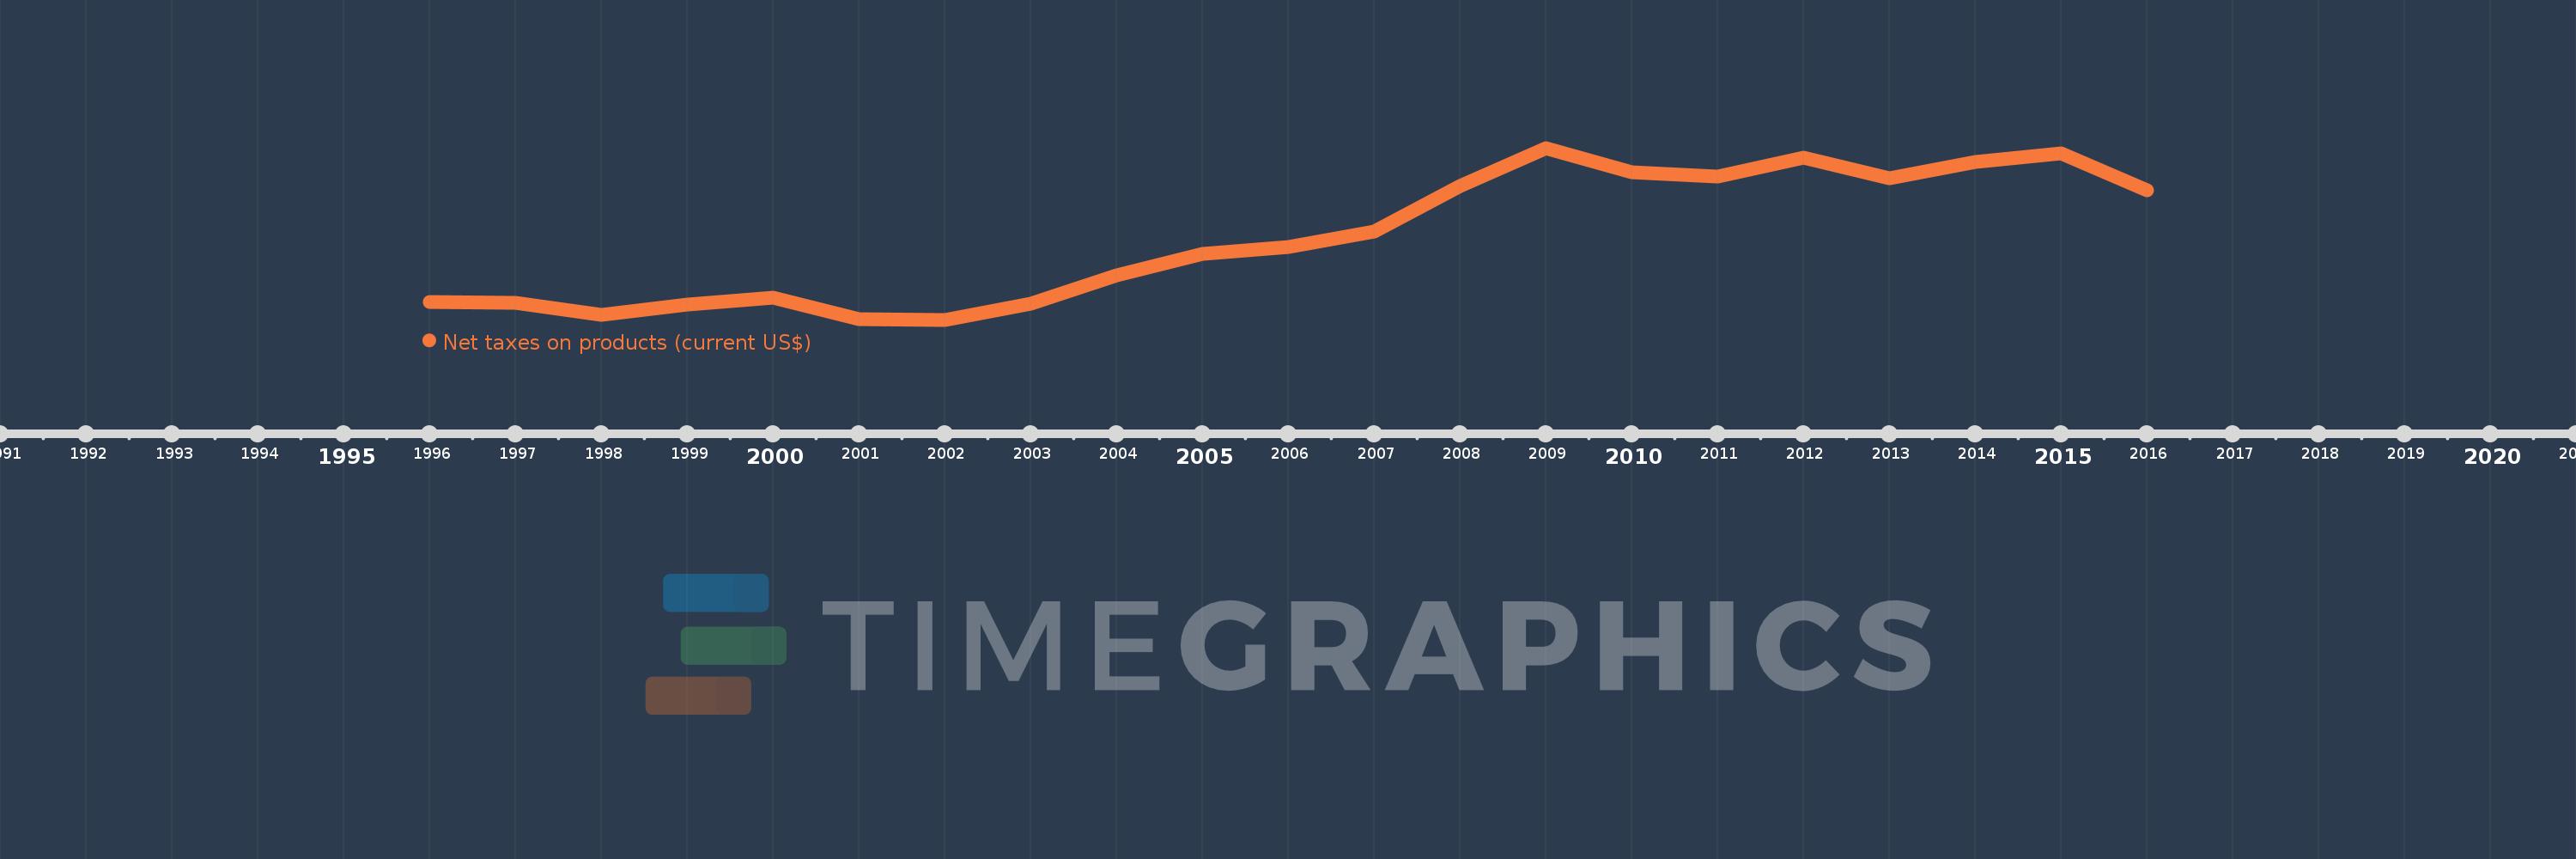
Net taxes on products (current US$)
2016,2015,2014,2013,2012,2011,2010,2009,2008,2007,2006,2005,2004,2003,2002,2001,2000,1999,1998,1997,1996
This statistics in other country:
AfghanistanAlbaniaAlgeriaAndorraAntigua and BarbudaArgentinaArmeniaArubaAustraliaAustriaAzerbaijanBahamas, TheBahrainBangladeshBarbadosBelarusBelgiumBelizeBeninBermudaBhutanBoliviaBosnia and HerzegovinaBotswanaBrazilBulgariaBurkina FasoBurundiCabo VerdeCambodiaCameroonCanadaCentral African RepublicChadChileColombiaCongo, Dem. Rep.Costa RicaCroatiaCubaCyprusCzech RepublicDenmarkDjiboutiDominicaDominican RepublicEcuadorEgypt, Arab Rep.El SalvadorEquatorial GuineaEritreaEstoniaEthiopiaFaroe IslandsFijiFinlandFranceGabonGambia, TheGeorgiaGermanyGhanaGreeceGrenadaGuatemalaGuineaGuinea-BissauGuyanaHondurasHong Kong SAR, ChinaHungaryIndiaIndonesiaIran, Islamic Rep.IrelandItalyJamaicaJapanJordanKazakhstanKenyaKiribatiKorea, Rep.KosovoKyrgyz RepublicLao PDRLatviaLebanonLesothoLiberiaLiechtensteinLithuaniaLuxembourgMacao SAR, ChinaMacedonia, FYRMadagascarMalawiMalaysiaMaldivesMaliMarshall IslandsMauritaniaMauritiusMexicoMicronesia, Fed. Sts.MoldovaMongoliaMontenegroMoroccoMozambiqueNamibiaNepalNetherlandsNew ZealandNicaraguaNigerNigeriaNorwayOmanPakistanPalauPanamaPapua New GuineaParaguayPeruPolandPortugalRomaniaRussian FederationRwandaSao Tome and PrincipeSenegalSerbiaSeychellesSierra LeoneSingaporeSlovak RepublicSloveniaSolomon IslandsSouth AfricaSpainSri LankaSt. Kitts and NevisSt. LuciaSt. Vincent and the GrenadinesSudanSurinameSwazilandSwedenSwitzerlandSyrian Arab RepublicTajikistanTanzaniaThailandTimor-LesteTongaTrinidad and TobagoTunisiaTurkeyTurkmenistanTuvaluUgandaUkraineUnited KingdomUnited StatesUruguayUzbekistanVanuatuVenezuela, RBVietnamWest Bank and GazaYemen, Rep.ZambiaZimbabwe Timeline:
This timeline shows a graph from 1996 to 2016 of Slovenia. No data until 1995. Number of actual observations by date: 21.
Source name:
World Development Indicators
Source organization:
World Bank national accounts data, and OECD National Accounts data files.
Categories, topics:
Economy & Growth
Last updated:
apr 23, 2017
Indicators value changes by year
Minimum:
2.559 bln
jan 1, 2002
Maximum:
6.916 bln
jan 1, 2009
At the date of observation
Value
Absolute change
Change from previous value
jan 1, 1996
3.015 bln
+3.015 bln
0.0%
jan 1, 1997
2.995 bln
-20.714 mln
-0.69%
jan 1, 1998
2.677 bln
-317.745 mln
-10.61%
jan 1, 1999
2.941 bln
+264.324 mln
9.87%
jan 1, 2000
3.115 bln
+173.953 mln
5.91%
jan 1, 2001
2.571 bln
-544.172 mln
-17.47%
jan 1, 2002
2.559 bln
-12.3 mln
-0.48%
jan 1, 2003
2.975 bln
+416.467 mln
16.28%
jan 1, 2004
3.696 bln
+720.609 mln
24.22%
jan 1, 2005
4.222 bln
+525.793 mln
14.23%
jan 1, 2006
4.408 bln
+186.964 mln
4.43%
jan 1, 2007
4.793 bln
+384.811 mln
8.73%
jan 1, 2008
5.946 bln
+1.152 bln
24.04%
jan 1, 2009
6.916 bln
+970.104 mln
16.32%
jan 1, 2010
6.29 bln
-625.241 mln
-9.04%
jan 1, 2011
6.185 bln
-105.44 mln
-1.68%
jan 1, 2012
6.659 bln
+474.392 mln
7.67%
jan 1, 2013
6.138 bln
-521.724 mln
-7.83%
jan 1, 2014
6.566 bln
+427.904 mln
6.97%
jan 1, 2015
6.768 bln
+202.574 mln
3.09%
jan 1, 2016
5.832 bln
-936.264 mln
-13.83%
Ranking of countries by current statistics by years


Comments: