29
/
en
AIzaSyAYiBZKx7MnpbEhh9jyipgxe19OcubqV5w
April 1, 2024
283937
West Bank and Gaza
PSE
true
2
1
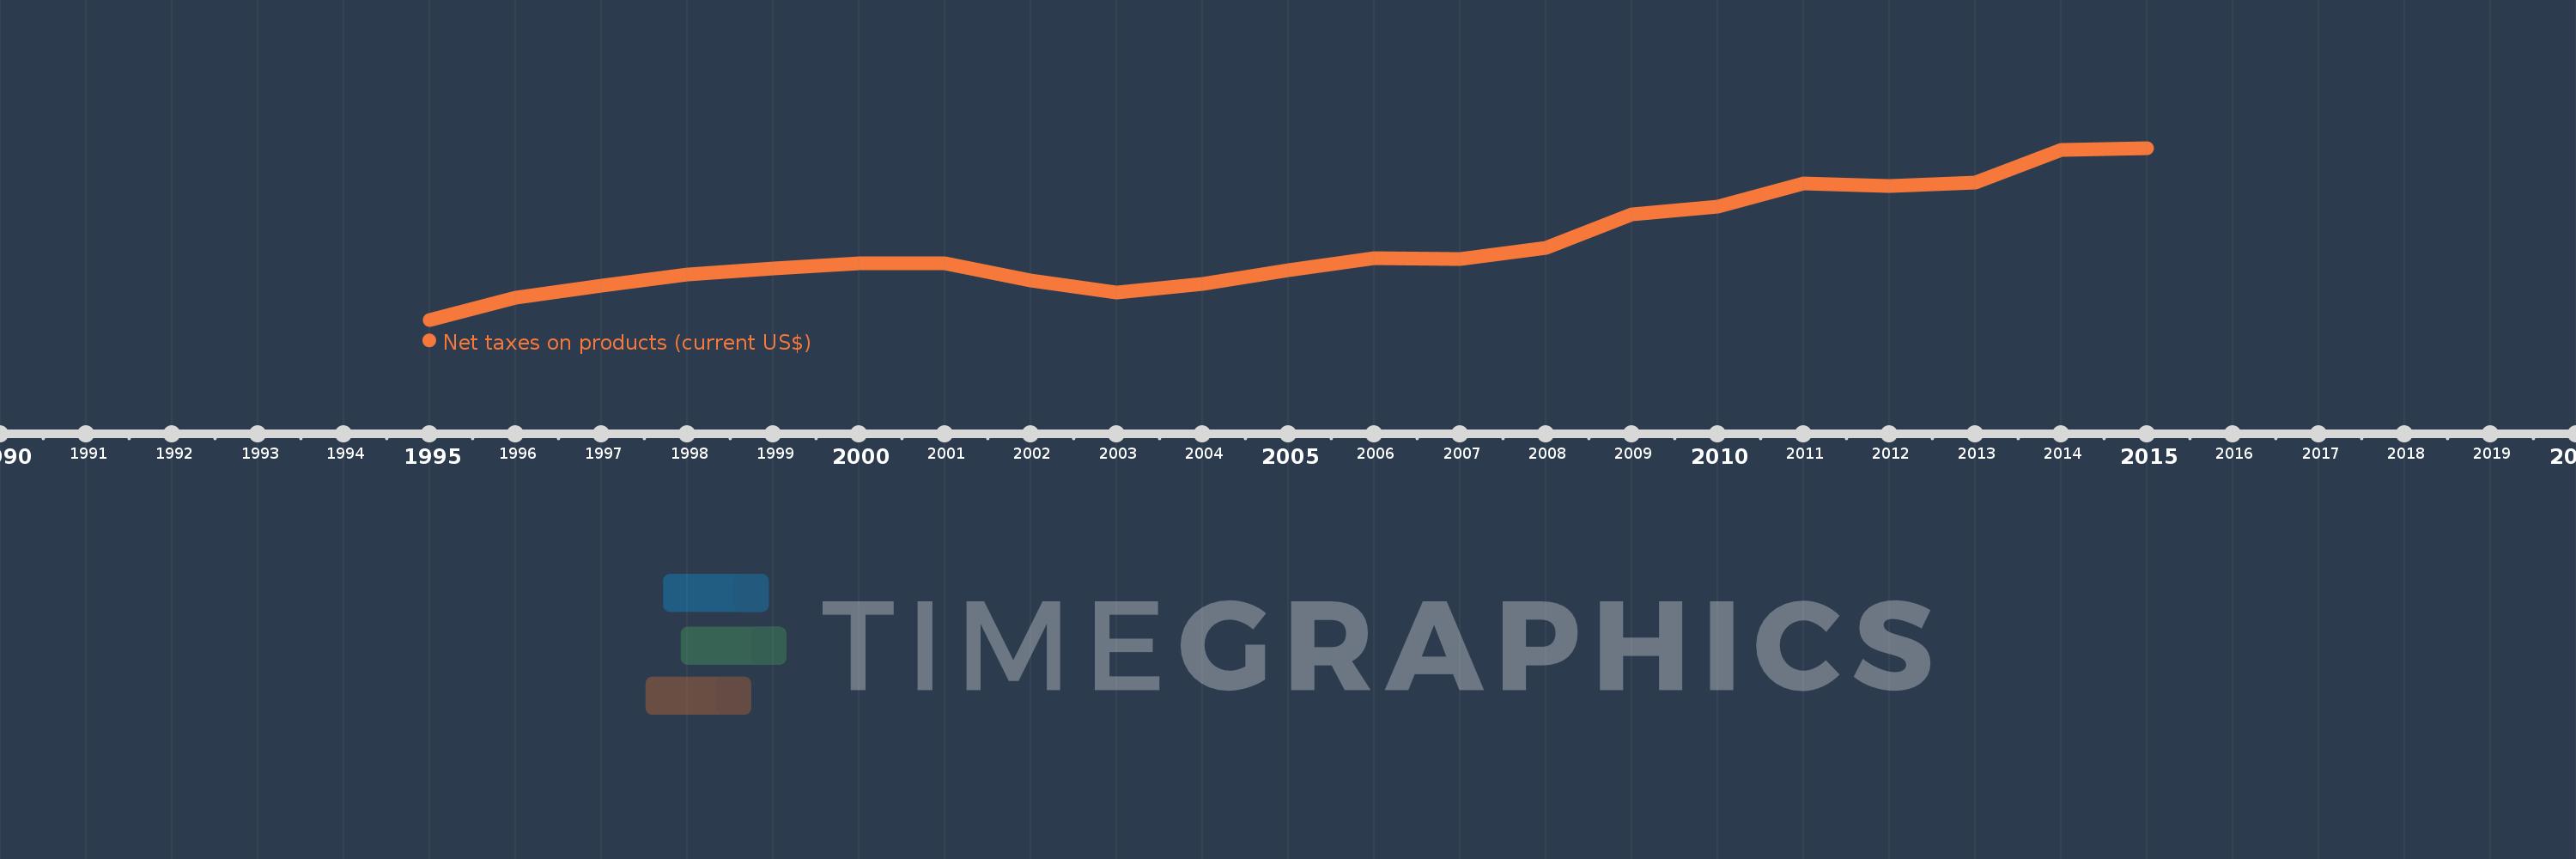
Net taxes on products (current US$)
2015,2014,2013,2012,2011,2010,2009,2008,2007,2006,2005,2004,2003,2002,2001,2000,1999,1998,1997,1996,1995
This statistics in other country:
AfghanistanAlbaniaAlgeriaAndorraAntigua and BarbudaArgentinaArmeniaArubaAustraliaAustriaAzerbaijanBahamas, TheBahrainBangladeshBarbadosBelarusBelgiumBelizeBeninBermudaBhutanBoliviaBosnia and HerzegovinaBotswanaBrazilBulgariaBurkina FasoBurundiCabo VerdeCambodiaCameroonCanadaCentral African RepublicChadChileColombiaCongo, Dem. Rep.Costa RicaCroatiaCubaCyprusCzech RepublicDenmarkDjiboutiDominicaDominican RepublicEcuadorEgypt, Arab Rep.El SalvadorEquatorial GuineaEritreaEstoniaEthiopiaFaroe IslandsFijiFinlandFranceGabonGambia, TheGeorgiaGermanyGhanaGreeceGrenadaGuatemalaGuineaGuinea-BissauGuyanaHondurasHong Kong SAR, ChinaHungaryIndiaIndonesiaIran, Islamic Rep.IrelandItalyJamaicaJapanJordanKazakhstanKenyaKiribatiKorea, Rep.KosovoKyrgyz RepublicLao PDRLatviaLebanonLesothoLiberiaLiechtensteinLithuaniaLuxembourgMacao SAR, ChinaMacedonia, FYRMadagascarMalawiMalaysiaMaldivesMaliMarshall IslandsMauritaniaMauritiusMexicoMicronesia, Fed. Sts.MoldovaMongoliaMontenegroMoroccoMozambiqueNamibiaNepalNetherlandsNew ZealandNicaraguaNigerNigeriaNorwayOmanPakistanPalauPanamaPapua New GuineaParaguayPeruPolandPortugalRomaniaRussian FederationRwandaSao Tome and PrincipeSenegalSerbiaSeychellesSierra LeoneSingaporeSlovak RepublicSloveniaSolomon IslandsSouth AfricaSpainSri LankaSt. Kitts and NevisSt. LuciaSt. Vincent and the GrenadinesSudanSurinameSwazilandSwedenSwitzerlandSyrian Arab RepublicTajikistanTanzaniaThailandTimor-LesteTongaTrinidad and TobagoTunisiaTurkeyTurkmenistanTuvaluUgandaUkraineUnited KingdomUnited StatesUruguayUzbekistanVanuatuVenezuela, RBVietnamWest Bank and GazaYemen, Rep.ZambiaZimbabwe Timeline:
This timeline shows a graph from 1995 to 2015 of West Bank and Gaza. No data until 1994. Number of actual observations by date: 21.
Source name:
World Development Indicators
Source organization:
World Bank national accounts data, and OECD National Accounts data files.
Categories, topics:
Economy & Growth
Last updated:
apr 23, 2017
Indicators value changes by year
Minimum:
20.0 mln
jan 1, 1995
Maximum:
1.786 bln
jan 1, 2015
At the date of observation
Value
Absolute change
Change from previous value
jan 1, 1995
20.0 mln
+20.0 mln
0.0%
jan 1, 1996
247.2 mln
+227.2 mln
1.14K%
jan 1, 1997
367.0 mln
+119.8 mln
48.46%
jan 1, 1998
481.7 mln
+114.7 mln
31.25%
jan 1, 1999
548.9 mln
+67.2 mln
13.95%
jan 1, 2000
598.7 mln
+49.8 mln
9.07%
jan 1, 2001
598.2 mln
-499.993K
-0.08%
jan 1, 2002
425.5 mln
-172.7 mln
-28.87%
jan 1, 2003
298.9 mln
-126.6 mln
-29.75%
jan 1, 2004
390.5 mln
+91.6 mln
30.65%
jan 1, 2005
527.1 mln
+136.6 mln
34.98%
jan 1, 2006
651.4 mln
+124.3 mln
23.58%
jan 1, 2007
641.9 mln
-9.5 mln
-1.46%
jan 1, 2008
755.5 mln
+113.6 mln
17.7%
jan 1, 2009
1.102 bln
+346.1 mln
45.81%
jan 1, 2010
1.179 bln
+77.8 mln
7.06%
jan 1, 2011
1.421 bln
+241.1 mln
20.44%
jan 1, 2012
1.398 bln
-22.342 mln
-1.57%
jan 1, 2013
1.426 bln
+27.842 mln
1.99%
jan 1, 2014
1.767 bln
+341.0 mln
23.91%
jan 1, 2015
1.786 bln
+18.9 mln
1.07%
Ranking of countries by current statistics by years


Comments: