29
/
en
AIzaSyAYiBZKx7MnpbEhh9jyipgxe19OcubqV5w
April 1, 2024
225212
Poland
POL
true
2
1
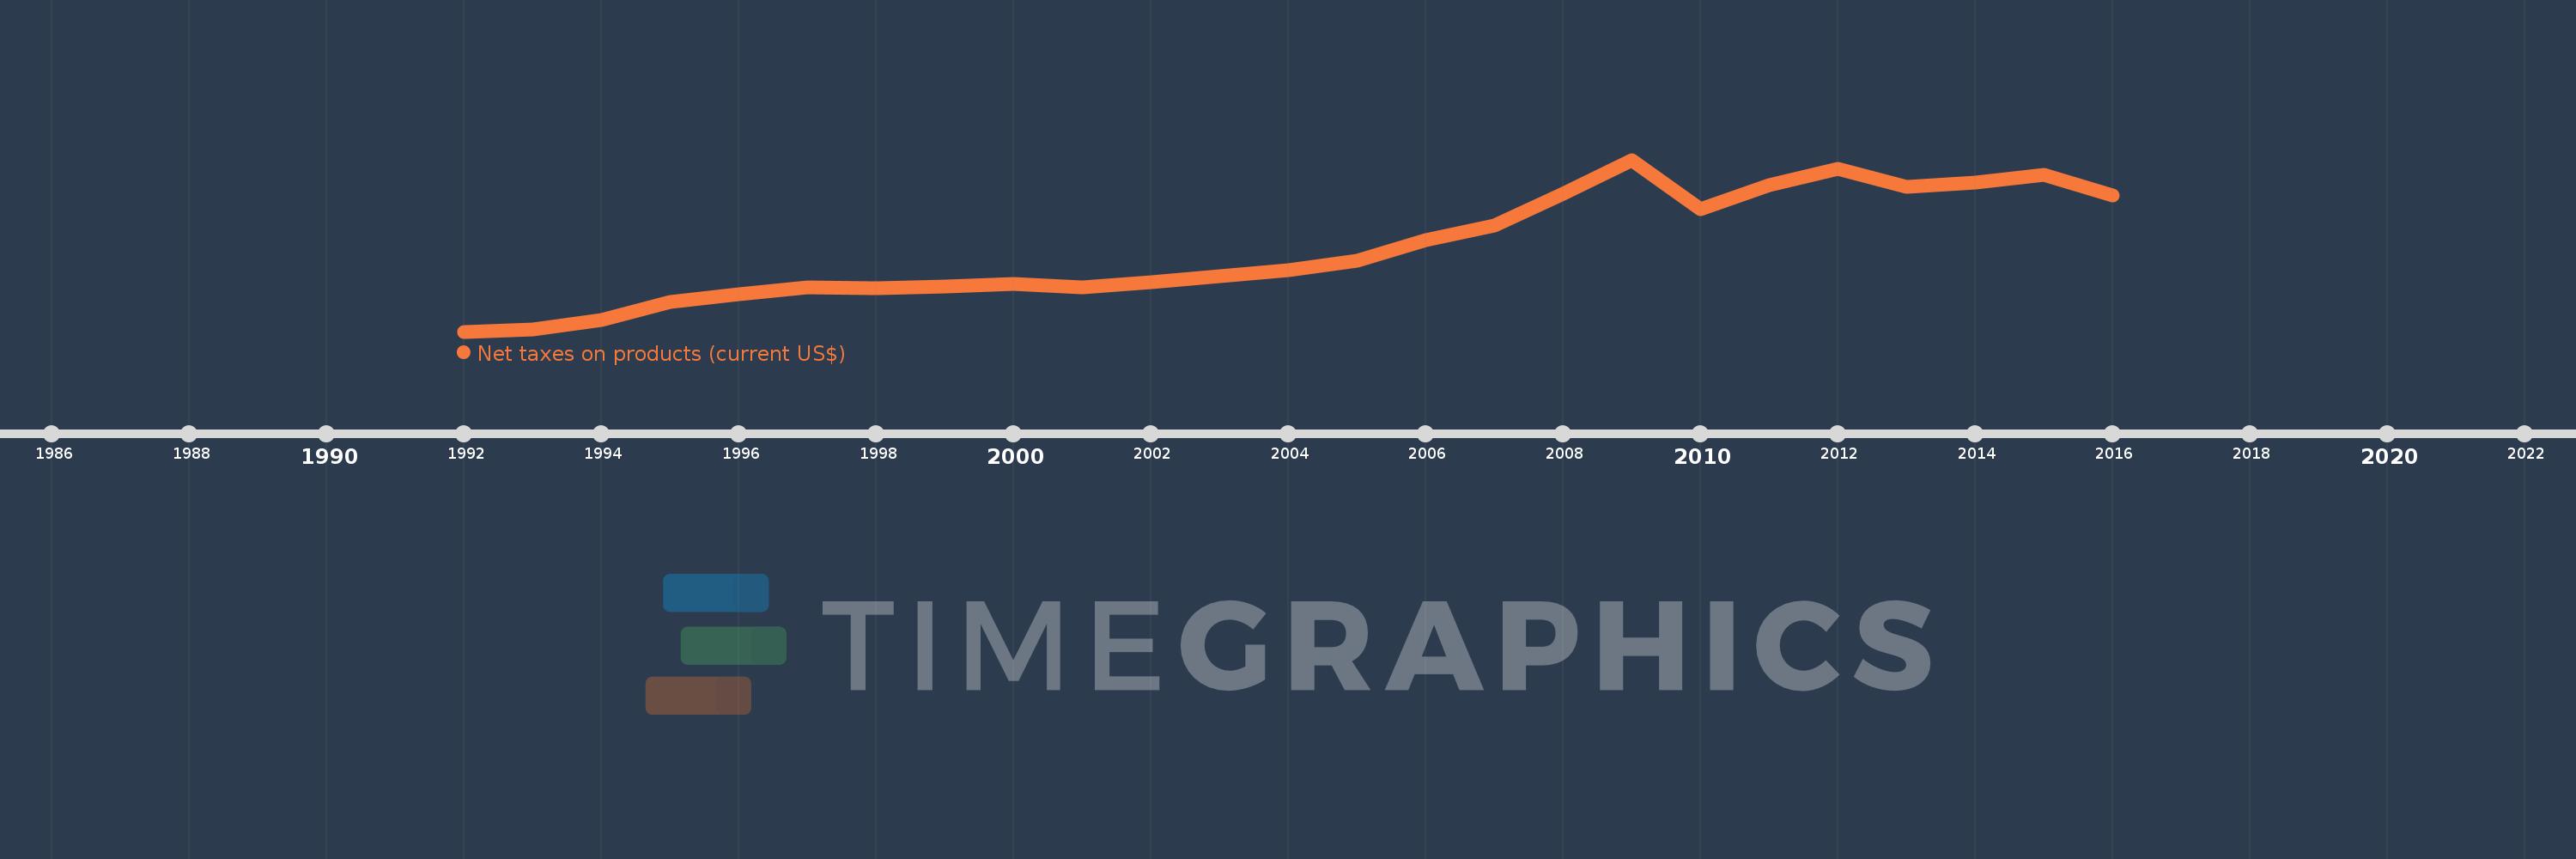
Net taxes on products (current US$)
2016,2015,2014,2013,2012,2011,2010,2009,2008,2007,2006,2005,2004,2003,2002,2001,2000,1999,1998,1997,1996,1995,1994,1993,1992
This statistics in other country:
AfghanistanAlbaniaAlgeriaAndorraAntigua and BarbudaArgentinaArmeniaArubaAustraliaAustriaAzerbaijanBahamas, TheBahrainBangladeshBarbadosBelarusBelgiumBelizeBeninBermudaBhutanBoliviaBosnia and HerzegovinaBotswanaBrazilBulgariaBurkina FasoBurundiCabo VerdeCambodiaCameroonCanadaCentral African RepublicChadChileColombiaCongo, Dem. Rep.Costa RicaCroatiaCubaCyprusCzech RepublicDenmarkDjiboutiDominicaDominican RepublicEcuadorEgypt, Arab Rep.El SalvadorEquatorial GuineaEritreaEstoniaEthiopiaFaroe IslandsFijiFinlandFranceGabonGambia, TheGeorgiaGermanyGhanaGreeceGrenadaGuatemalaGuineaGuinea-BissauGuyanaHondurasHong Kong SAR, ChinaHungaryIndiaIndonesiaIran, Islamic Rep.IrelandItalyJamaicaJapanJordanKazakhstanKenyaKiribatiKorea, Rep.KosovoKyrgyz RepublicLao PDRLatviaLebanonLesothoLiberiaLiechtensteinLithuaniaLuxembourgMacao SAR, ChinaMacedonia, FYRMadagascarMalawiMalaysiaMaldivesMaliMarshall IslandsMauritaniaMauritiusMexicoMicronesia, Fed. Sts.MoldovaMongoliaMontenegroMoroccoMozambiqueNamibiaNepalNetherlandsNew ZealandNicaraguaNigerNigeriaNorwayOmanPakistanPalauPanamaPapua New GuineaParaguayPeruPolandPortugalRomaniaRussian FederationRwandaSao Tome and PrincipeSenegalSerbiaSeychellesSierra LeoneSingaporeSlovak RepublicSloveniaSolomon IslandsSouth AfricaSpainSri LankaSt. Kitts and NevisSt. LuciaSt. Vincent and the GrenadinesSudanSurinameSwazilandSwedenSwitzerlandSyrian Arab RepublicTajikistanTanzaniaThailandTimor-LesteTongaTrinidad and TobagoTunisiaTurkeyTurkmenistanTuvaluUgandaUkraineUnited KingdomUnited StatesUruguayUzbekistanVanuatuVenezuela, RBVietnamWest Bank and GazaYemen, Rep.ZambiaZimbabwe Timeline:
This timeline shows a graph from 1992 to 2016 of Poland. No data until 1991. Number of actual observations by date: 25.
Source name:
World Development Indicators
Source organization:
World Bank national accounts data, and OECD National Accounts data files.
Categories, topics:
Economy & Growth
Last updated:
apr 23, 2017
Indicators value changes by year
Minimum:
2.592 bln
jan 1, 1992
Maximum:
67.346 bln
jan 1, 2009
At the date of observation
Value
Absolute change
Change from previous value
jan 1, 1992
2.592 bln
+2.592 bln
0.0%
jan 1, 1993
3.512 bln
+919.814 mln
35.48%
jan 1, 1994
6.852 bln
+3.34 bln
95.09%
jan 1, 1995
13.804 bln
+6.952 bln
101.45%
jan 1, 1996
16.783 bln
+2.979 bln
21.58%
jan 1, 1997
19.27 bln
+2.487 bln
14.82%
jan 1, 1998
18.795 bln
-475.192 mln
-2.47%
jan 1, 1999
19.728 bln
+932.936 mln
4.96%
jan 1, 2000
20.471 bln
+742.82 mln
3.77%
jan 1, 2001
19.365 bln
-1.106 bln
-5.4%
jan 1, 2002
21.185 bln
+1.82 bln
9.4%
jan 1, 2003
23.443 bln
+2.258 bln
10.66%
jan 1, 2004
25.897 bln
+2.454 bln
10.47%
jan 1, 2005
29.45 bln
+3.553 bln
13.72%
jan 1, 2006
37.126 bln
+7.676 bln
26.07%
jan 1, 2007
42.61 bln
+5.483 bln
14.77%
jan 1, 2008
54.621 bln
+12.011 bln
28.19%
jan 1, 2009
67.346 bln
+12.725 bln
23.3%
jan 1, 2010
48.752 bln
-18.594 bln
-27.61%
jan 1, 2011
57.647 bln
+8.895 bln
18.25%
jan 1, 2012
64.08 bln
+6.434 bln
11.16%
jan 1, 2013
57.045 bln
-7.036 bln
-10.98%
jan 1, 2014
58.842 bln
+1.798 bln
3.15%
jan 1, 2015
61.742 bln
+2.899 bln
4.93%
jan 1, 2016
53.86 bln
-7.881 bln
-12.77%
Ranking of countries by current statistics by years


Comments: