29
/
en
AIzaSyAYiBZKx7MnpbEhh9jyipgxe19OcubqV5w
April 1, 2024
237161
Serbia
SRB
true
2
1
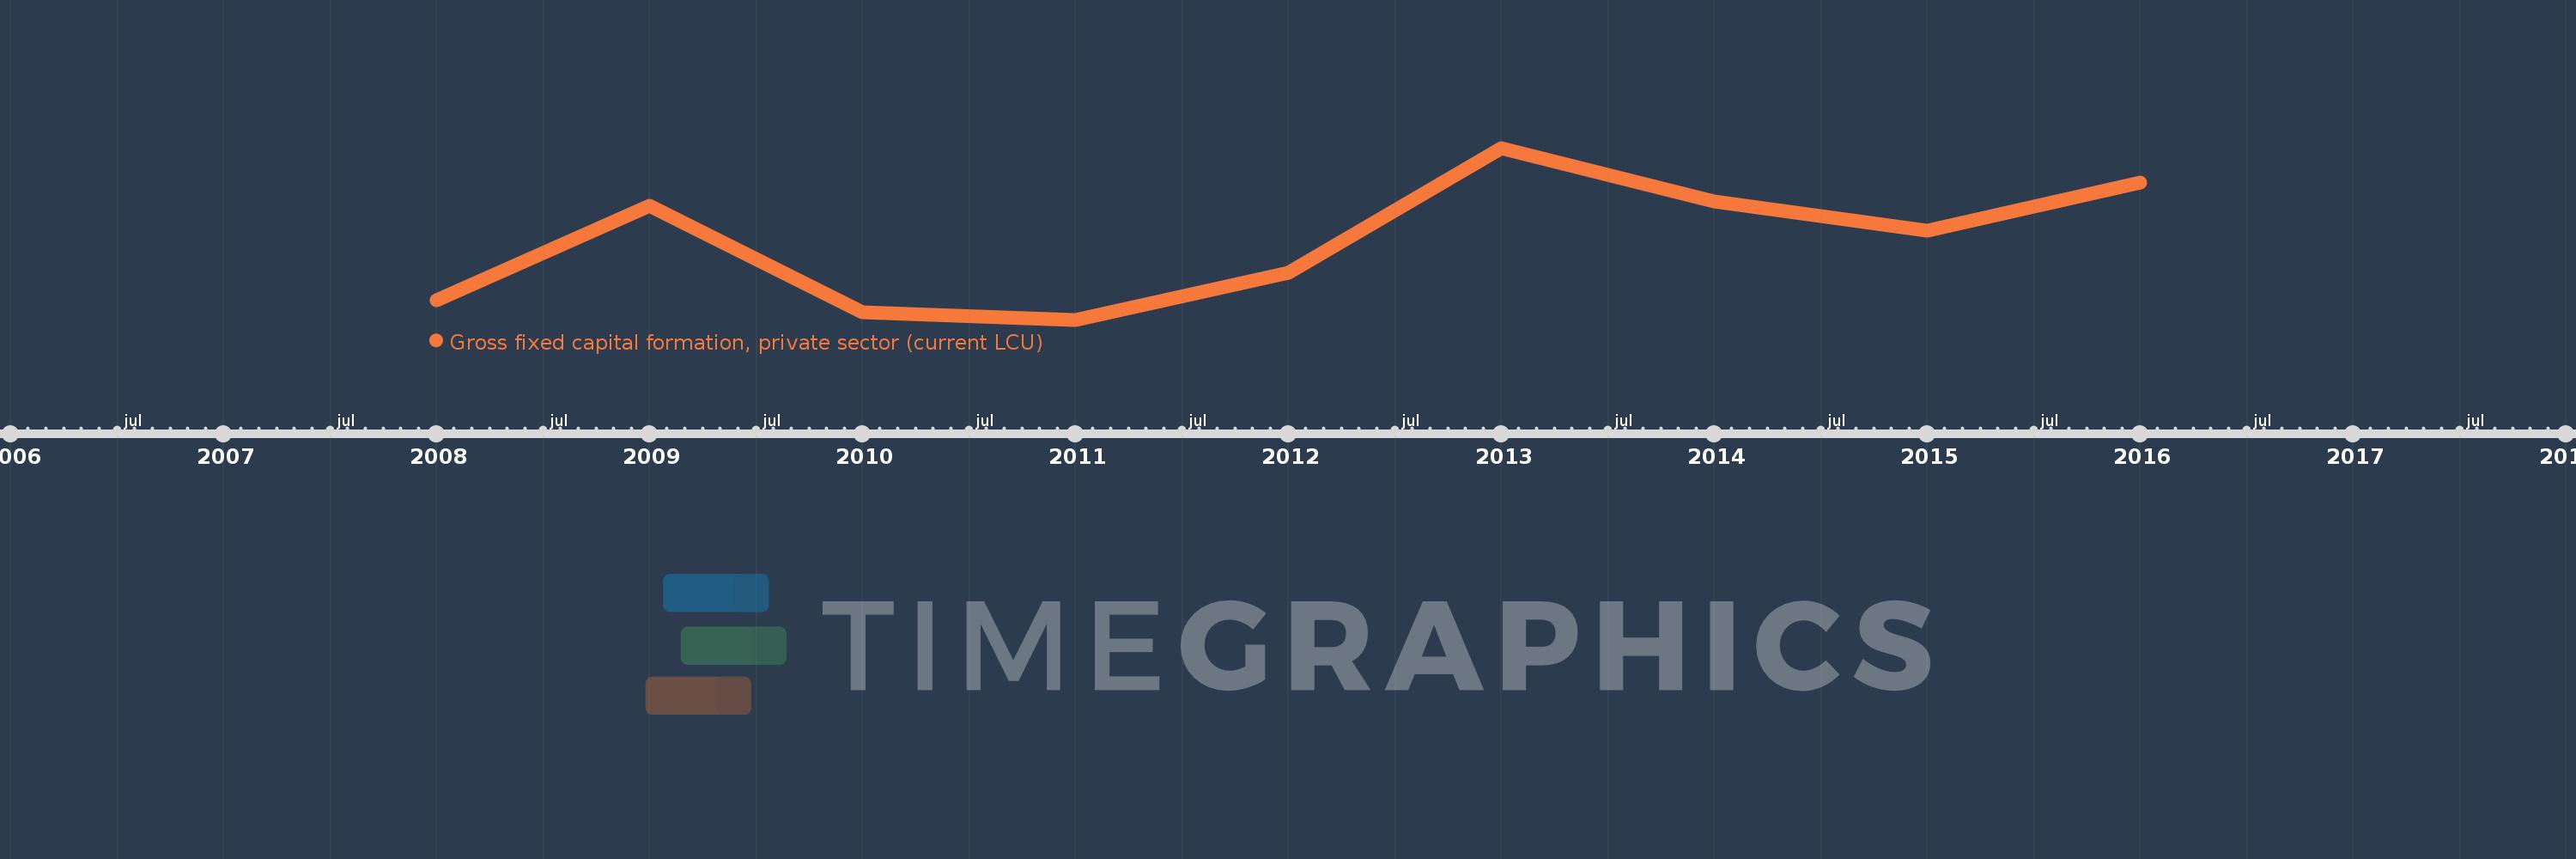
Gross fixed capital formation, private sector (current LCU)
2016,2015,2014,2013,2012,2011,2010,2009,2008
This statistics in other country:
Timeline:
This timeline shows a graph from 2008 to 2016 of Serbia. No data until 2007. Number of actual observations by date: 9.
Source name:
World Development Indicators
Source organization:
World Bank national accounts data, and OECD National Accounts data files.
Categories, topics:
Economy & Growth
Last updated:
apr 23, 2017
Indicators value changes by year
Minimum:
464.95 bln
jan 1, 2011
Maximum:
639.466 bln
jan 1, 2013
At the date of observation
Value
Absolute change
Change from previous value
jan 1, 2008
485.059 bln
+485.059 bln
0.0%
jan 1, 2009
580.966 bln
+95.907 bln
19.77%
jan 1, 2010
472.858 bln
-108.108 bln
-18.61%
jan 1, 2011
464.95 bln
-7.907 bln
-1.67%
jan 1, 2012
512.63 bln
+47.68 bln
10.25%
jan 1, 2013
639.466 bln
+126.836 bln
24.74%
jan 1, 2014
585.54 bln
-53.926 bln
-8.43%
jan 1, 2015
555.342 bln
-30.199 bln
-5.16%
jan 1, 2016
604.207 bln
+48.865 bln
8.8%
Ranking of countries by current statistics by years


Comments: