29
/
en
AIzaSyAYiBZKx7MnpbEhh9jyipgxe19OcubqV5w
April 1, 2024
108576
Comoros
COM
true
2
1
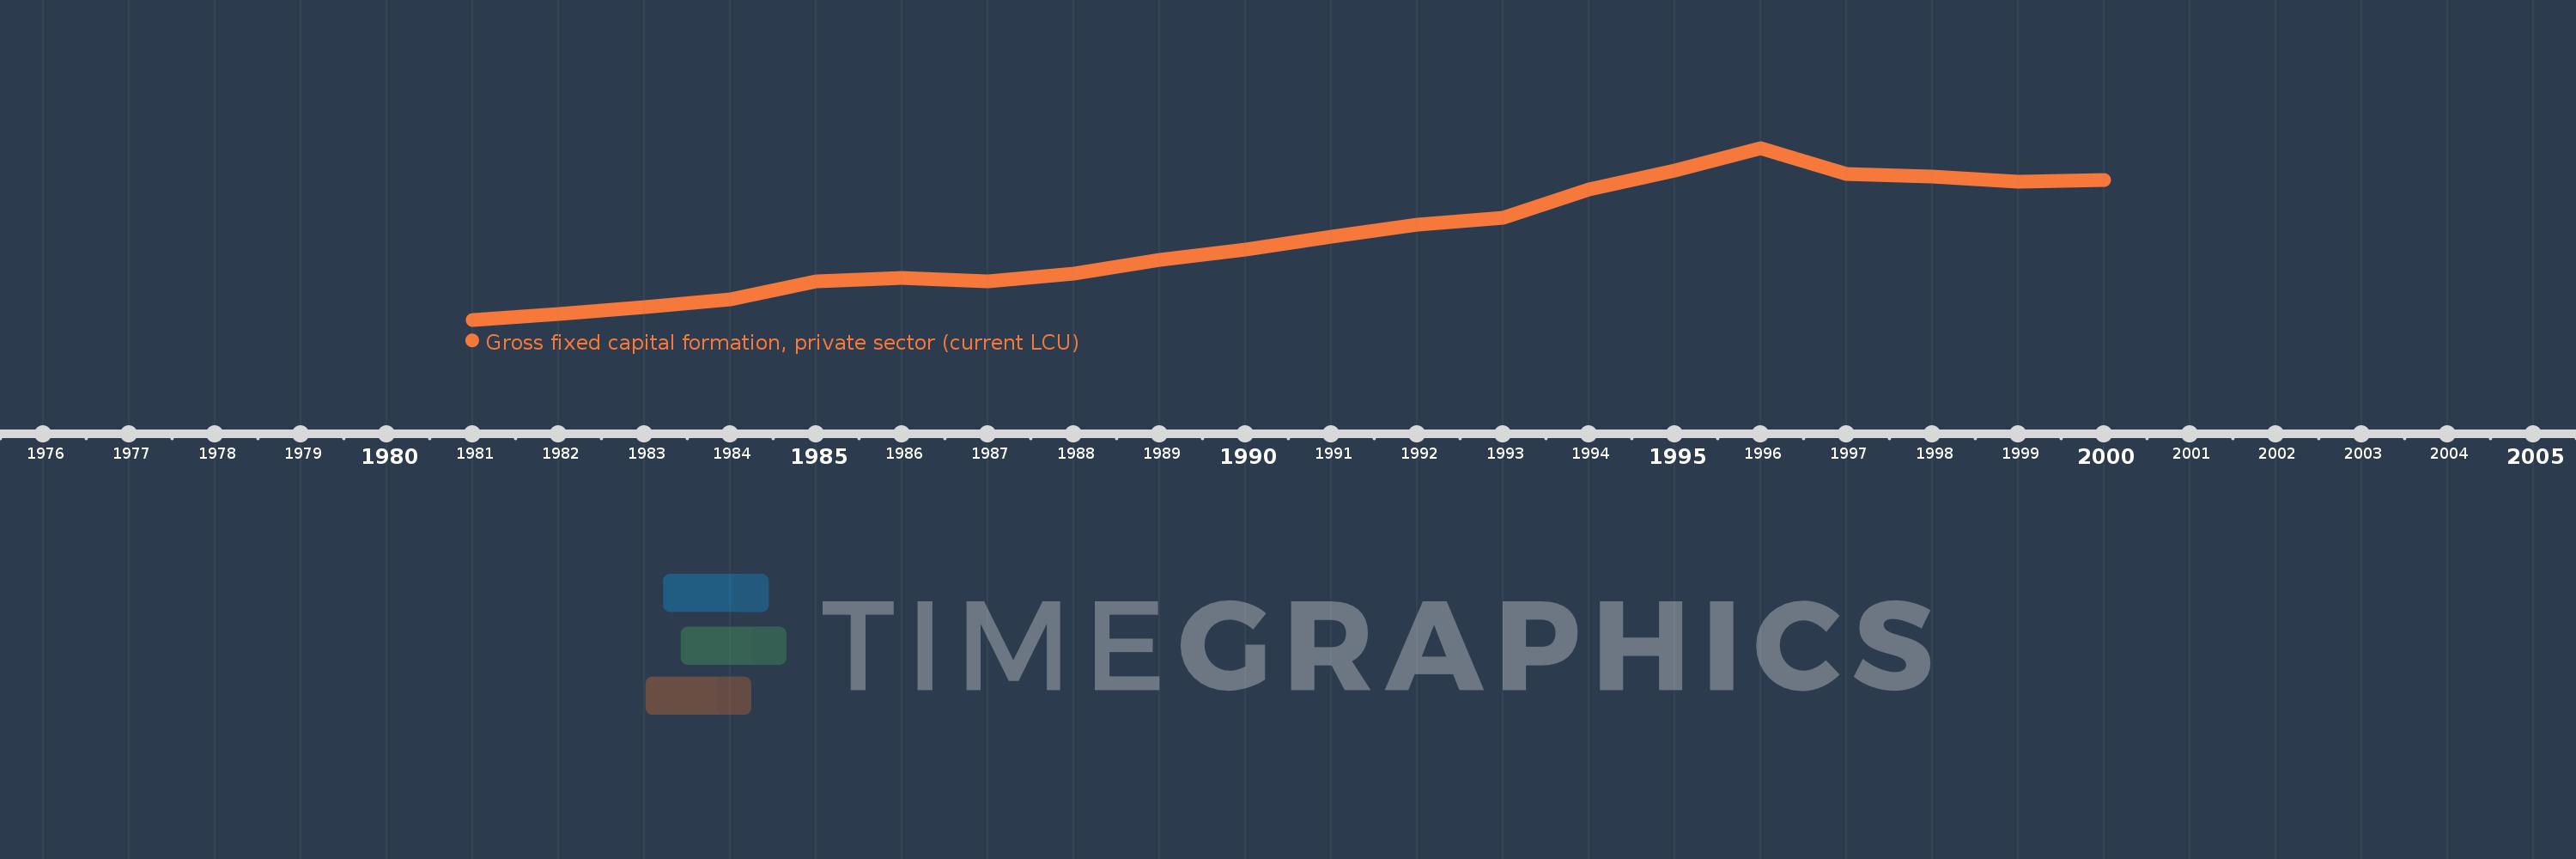
Gross fixed capital formation, private sector (current LCU)
2000,1999,1998,1997,1996,1995,1994,1993,1992,1991,1990,1989,1988,1987,1986,1985,1984,1983,1982,1981
This statistics in other country:
Timeline:
This timeline shows a graph from 1981 to 2000 of Comoros. No data until 1980. Number of actual observations by date: 20.
Source name:
World Development Indicators
Source organization:
World Bank national accounts data, and OECD National Accounts data files.
Categories, topics:
Economy & Growth
Last updated:
apr 23, 2017
Indicators value changes by year
Minimum:
1.383 bln
jan 1, 1981
Maximum:
7.935 bln
jan 1, 1996
At the date of observation
Value
Absolute change
Change from previous value
jan 1, 1981
1.383 bln
+1.383 bln
0.0%
jan 1, 1982
1.587 bln
+204.0 mln
14.75%
jan 1, 1983
1.853 bln
+266.0 mln
16.76%
jan 1, 1984
2.168 bln
+315.0 mln
17.0%
jan 1, 1985
2.857 bln
+689.0 mln
31.78%
jan 1, 1986
2.988 bln
+131.0 mln
4.59%
jan 1, 1987
2.848 bln
-140.0 mln
-4.69%
jan 1, 1988
3.148 bln
+300.0 mln
10.53%
jan 1, 1989
3.663 bln
+515.0 mln
16.36%
jan 1, 1990
4.062 bln
+399.0 mln
10.89%
jan 1, 1991
4.548 bln
+486.0 mln
11.96%
jan 1, 1992
5.023 bln
+475.0 mln
10.44%
jan 1, 1993
5.275 bln
+252.0 mln
5.02%
jan 1, 1994
6.344 bln
+1.069 bln
20.27%
jan 1, 1995
7.08 bln
+736.0 mln
11.6%
jan 1, 1996
7.935 bln
+855.0 mln
12.08%
jan 1, 1997
6.943 bln
-992.0 mln
-12.5%
jan 1, 1998
6.85 bln
-93.0 mln
-1.34%
jan 1, 1999
6.658 bln
-192.0 mln
-2.8%
jan 1, 2000
6.725 bln
+67.0 mln
1.01%
Ranking of countries by current statistics by years


Comments: