29
/
en
AIzaSyAYiBZKx7MnpbEhh9jyipgxe19OcubqV5w
April 1, 2024
166212
Kazakhstan
KAZ
true
2
1
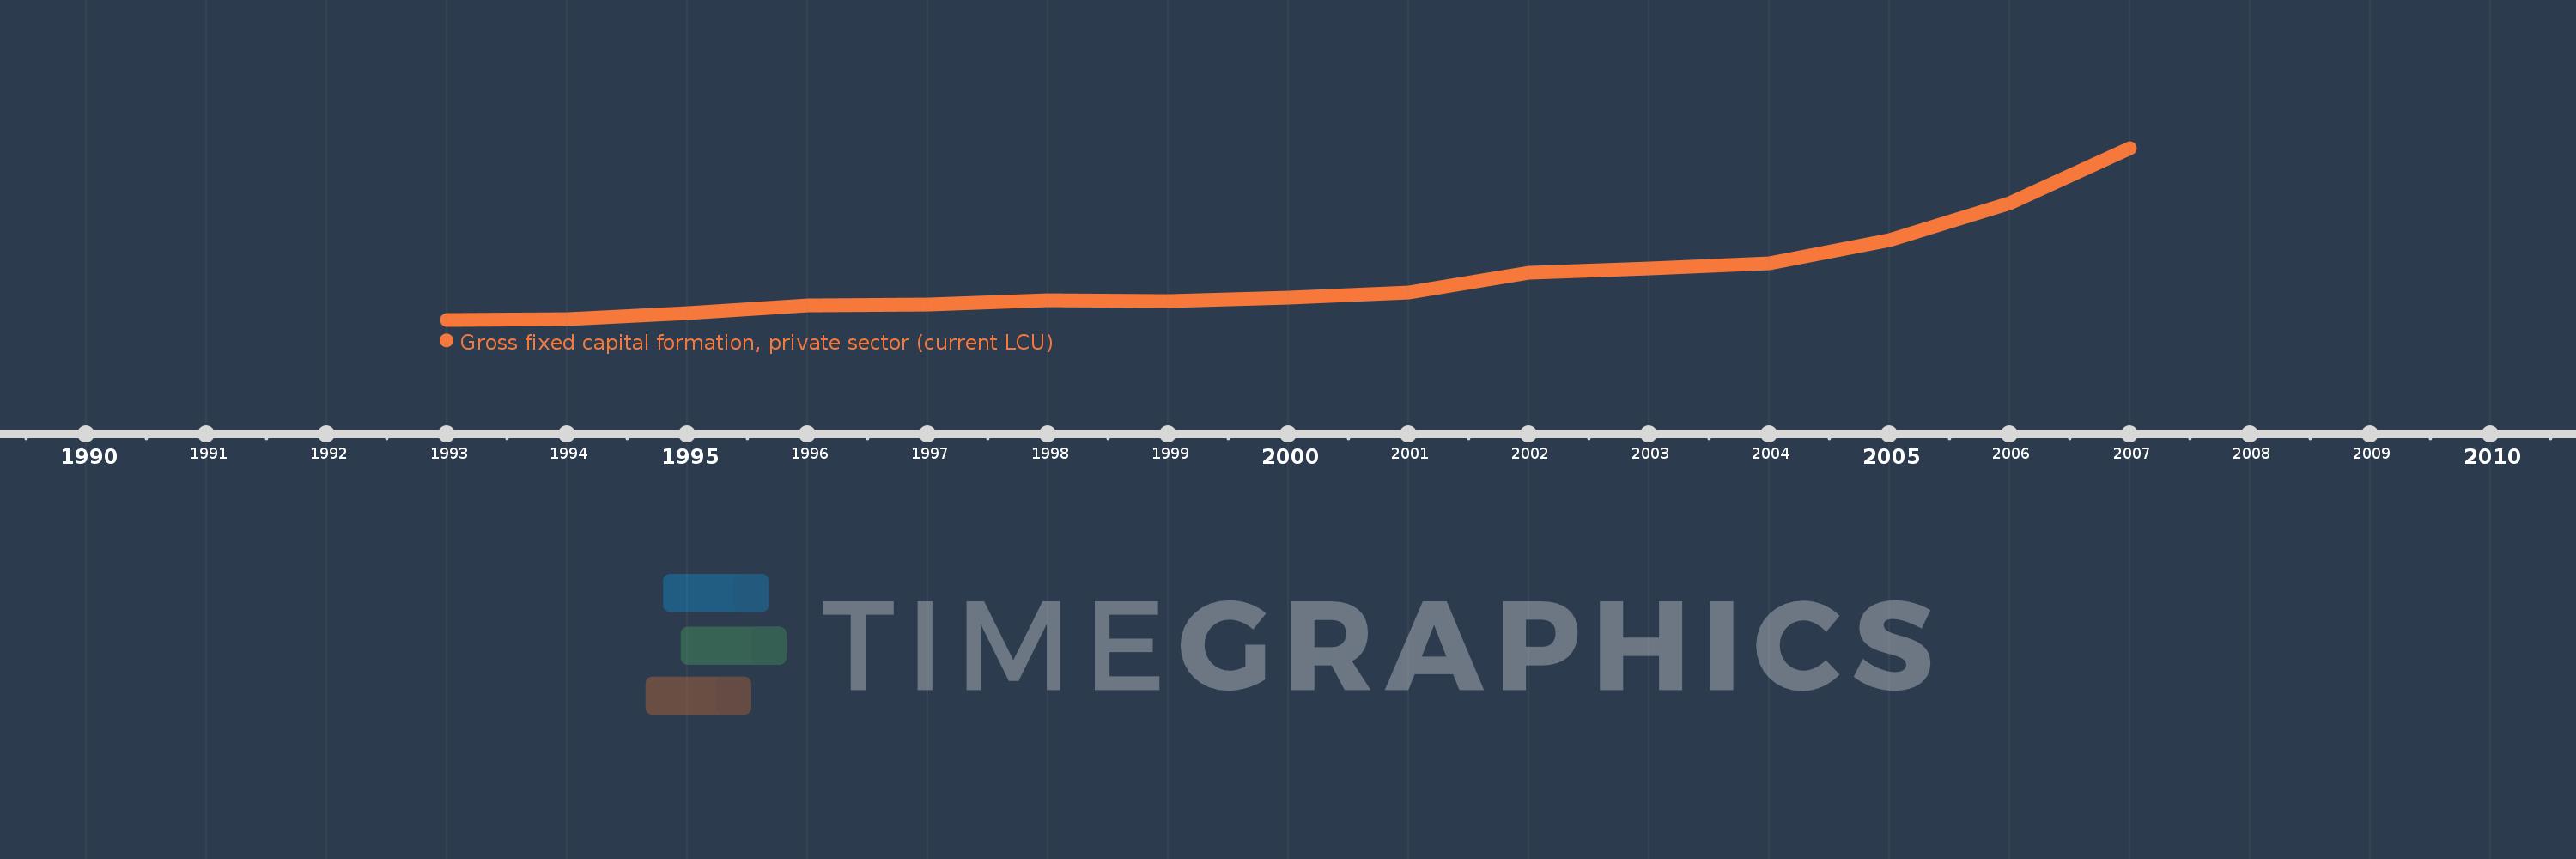
Gross fixed capital formation, private sector (current LCU)
2007,2006,2005,2004,2003,2002,2001,2000,1999,1998,1997,1996,1995,1994,1993
This statistics in other country:
Timeline:
This timeline shows a graph from 1993 to 2007 of Kazakhstan. No data until 1992. Number of actual observations by date: 15.
Source name:
World Development Indicators
Source organization:
World Bank national accounts data, and OECD National Accounts data files.
Categories, topics:
Economy & Growth
Last updated:
apr 23, 2017
Indicators value changes by year
Minimum:
572.0 mln
jan 1, 1993
Maximum:
2.622 trl
jan 1, 2007
At the date of observation
Value
Absolute change
Change from previous value
jan 1, 1993
572.0 mln
+572.0 mln
0.0%
jan 1, 1994
7.435 bln
+6.863 bln
1.2K%
jan 1, 1995
103.202 bln
+95.766 bln
1.29K%
jan 1, 1996
221.077 bln
+117.875 bln
114.22%
jan 1, 1997
232.14 bln
+11.063 bln
5.0%
jan 1, 1998
298.213 bln
+66.073 bln
28.46%
jan 1, 1999
283.943 bln
-14.27 bln
-4.79%
jan 1, 2000
332.821 bln
+48.878 bln
17.21%
jan 1, 2001
414.936 bln
+82.116 bln
24.67%
jan 1, 2002
712.494 bln
+297.558 bln
71.71%
jan 1, 2003
782.24 bln
+69.745 bln
9.79%
jan 1, 2004
868.278 bln
+86.038 bln
11.0%
jan 1, 2005
1.215 trl
+346.336 bln
39.89%
jan 1, 2006
1.776 trl
+561.204 bln
46.2%
jan 1, 2007
2.622 trl
+846.555 bln
47.67%
Ranking of countries by current statistics by years


Comments: