29
/
en
AIzaSyAYiBZKx7MnpbEhh9jyipgxe19OcubqV5w
April 1, 2024
231655
Rwanda
RWA
true
2
1
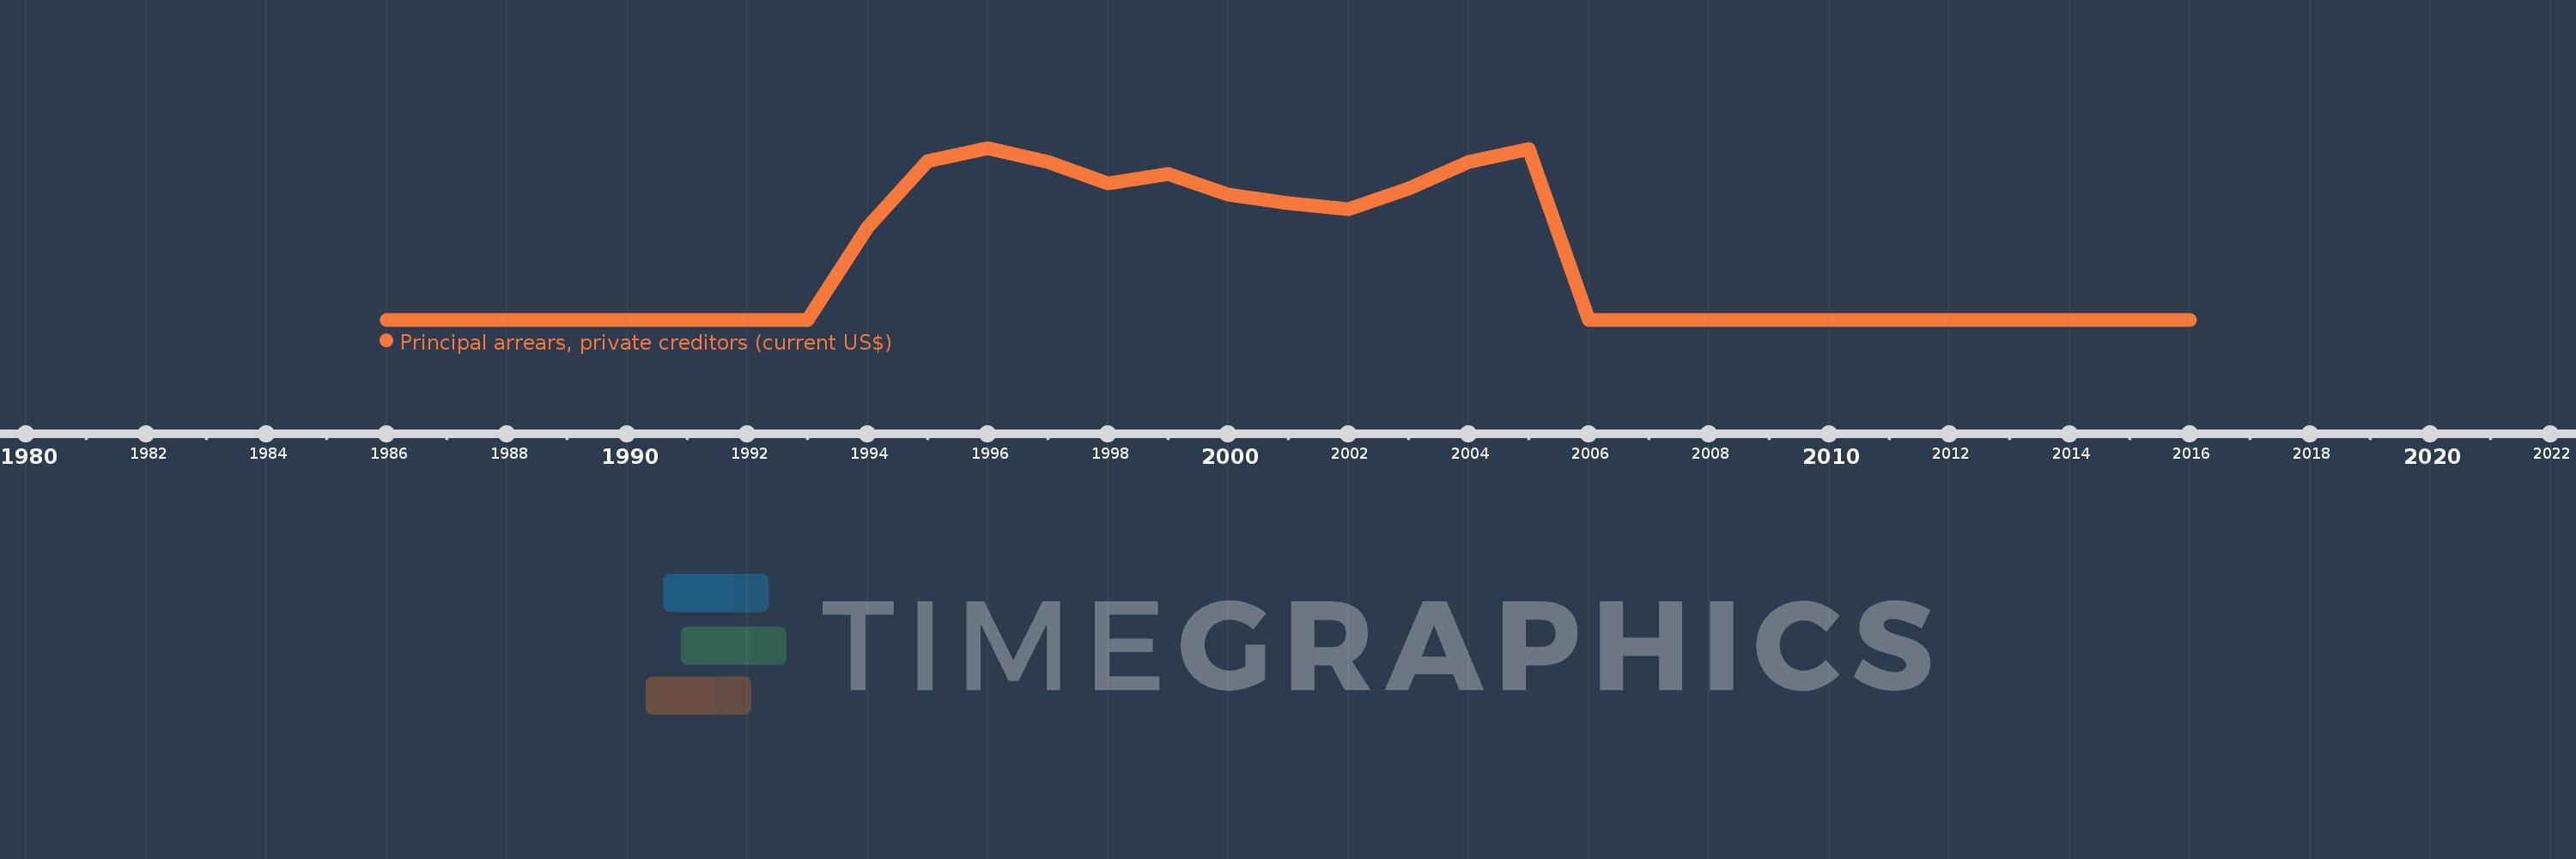
Principal arrears, private creditors (current US$)
2016,2015,2014,2006,2005,2004,2003,2002,2001,2000,1999,1998,1997,1996,1995,1994,1993,1992,1991,1990,1989,1988,1987,1986
This statistics in other country:
Timeline:
This timeline shows a graph from 1986 to 2016 of Rwanda. No data until 1985. Number of actual observations by date: 24.
Source name:
World Development Indicators
Source organization:
World Bank, International Debt Statistics.
Categories, topics:
External Debt
Last updated:
apr 23, 2017
Indicators value changes by year
Maximum:
1.684 mln
jan 1, 1996
At the date of observation
Value
Absolute change
Change from previous value
jan 1, 1994
910.0K
+910.0K
%
jan 1, 1995
1.557 mln
+647.0K
71.1%
jan 1, 1996
1.684 mln
+127.0K
8.16%
jan 1, 1997
1.55 mln
-134.0K
-7.96%
jan 1, 1998
1.339 mln
-211.0K
-13.61%
jan 1, 1999
1.43 mln
+91.0K
6.8%
jan 1, 2000
1.231 mln
-199.0K
-13.92%
jan 1, 2001
1.141 mln
-90.0K
-7.31%
jan 1, 2002
1.08 mln
-61.0K
-5.35%
jan 1, 2003
1.286 mln
+206.0K
19.07%
jan 1, 2004
1.549 mln
+263.0K
20.45%
jan 1, 2005
1.67 mln
+121.0K
7.81%
jan 1, 2006
0.0
-1.67 mln
-100.0%
Ranking of countries by current statistics by years


Comments: