29
/
en
AIzaSyAYiBZKx7MnpbEhh9jyipgxe19OcubqV5w
April 1, 2024
234115
Sao Tome and Principe
STP
true
2
1
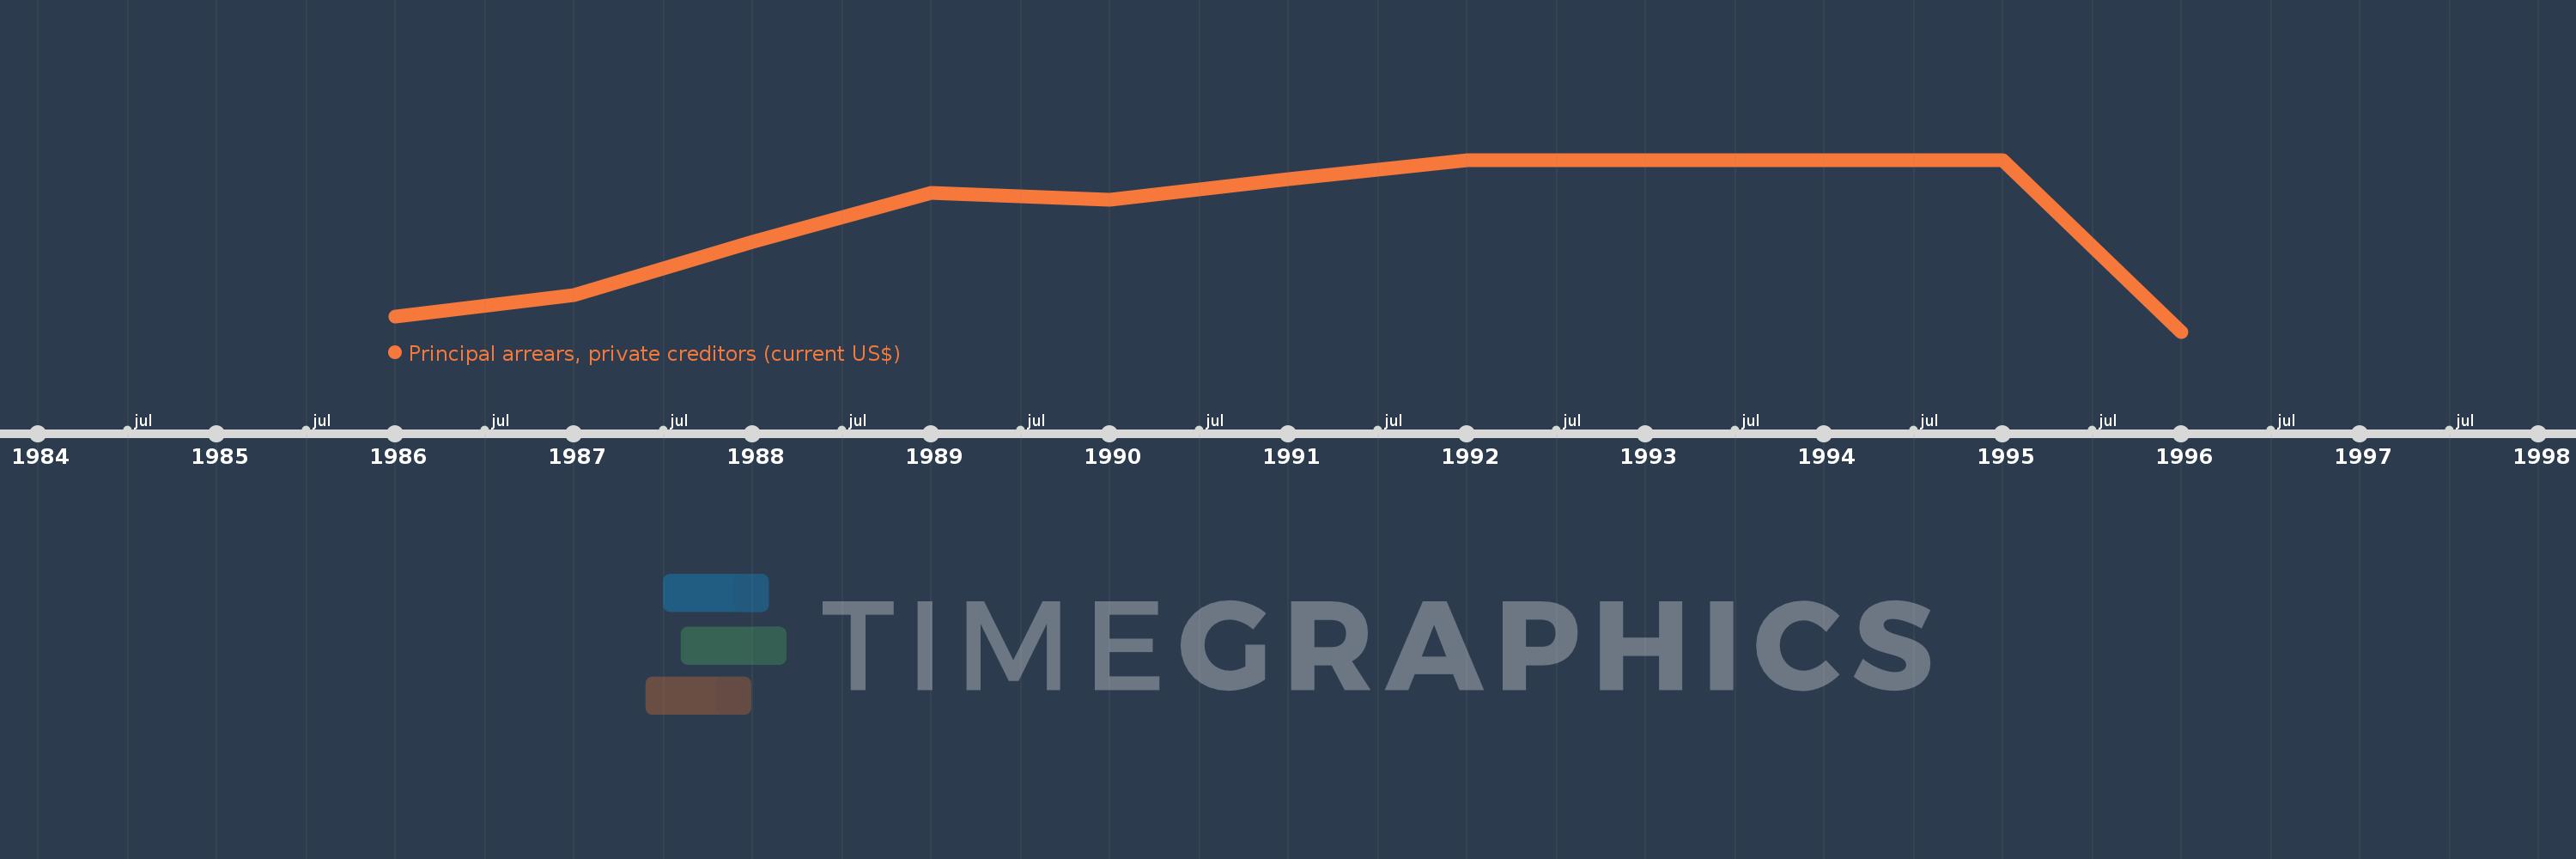
Principal arrears, private creditors (current US$)
1996,1995,1994,1993,1992,1991,1990,1989,1988,1987,1986
This statistics in other country:
Timeline:
This timeline shows a graph from 1986 to 1996 of Sao Tome and Principe. No data until 1985. Number of actual observations by date: 11.
Source name:
World Development Indicators
Source organization:
World Bank, International Debt Statistics.
Categories, topics:
External Debt
Last updated:
apr 23, 2017
Indicators value changes by year
Maximum:
1.132 mln
jan 1, 1992
At the date of observation
Value
Absolute change
Change from previous value
jan 1, 1986
97.0K
+97.0K
0.0%
jan 1, 1987
239.0K
+142.0K
146.39%
jan 1, 1988
589.0K
+350.0K
146.44%
jan 1, 1989
915.0K
+326.0K
55.35%
jan 1, 1990
870.0K
-45.0K
-4.92%
jan 1, 1991
1.006 mln
+136.0K
15.63%
jan 1, 1992
1.132 mln
+126.0K
12.52%
jan 1, 1993
1.132 mln
0.0
0.0%
jan 1, 1994
1.132 mln
0.0
0.0%
jan 1, 1995
1.132 mln
0.0
0.0%
jan 1, 1996
0.0
-1.132 mln
-100.0%
Ranking of countries by current statistics by years


Comments: