29
/
en
AIzaSyAYiBZKx7MnpbEhh9jyipgxe19OcubqV5w
April 1, 2024
212307
Niger
NER
true
2
1
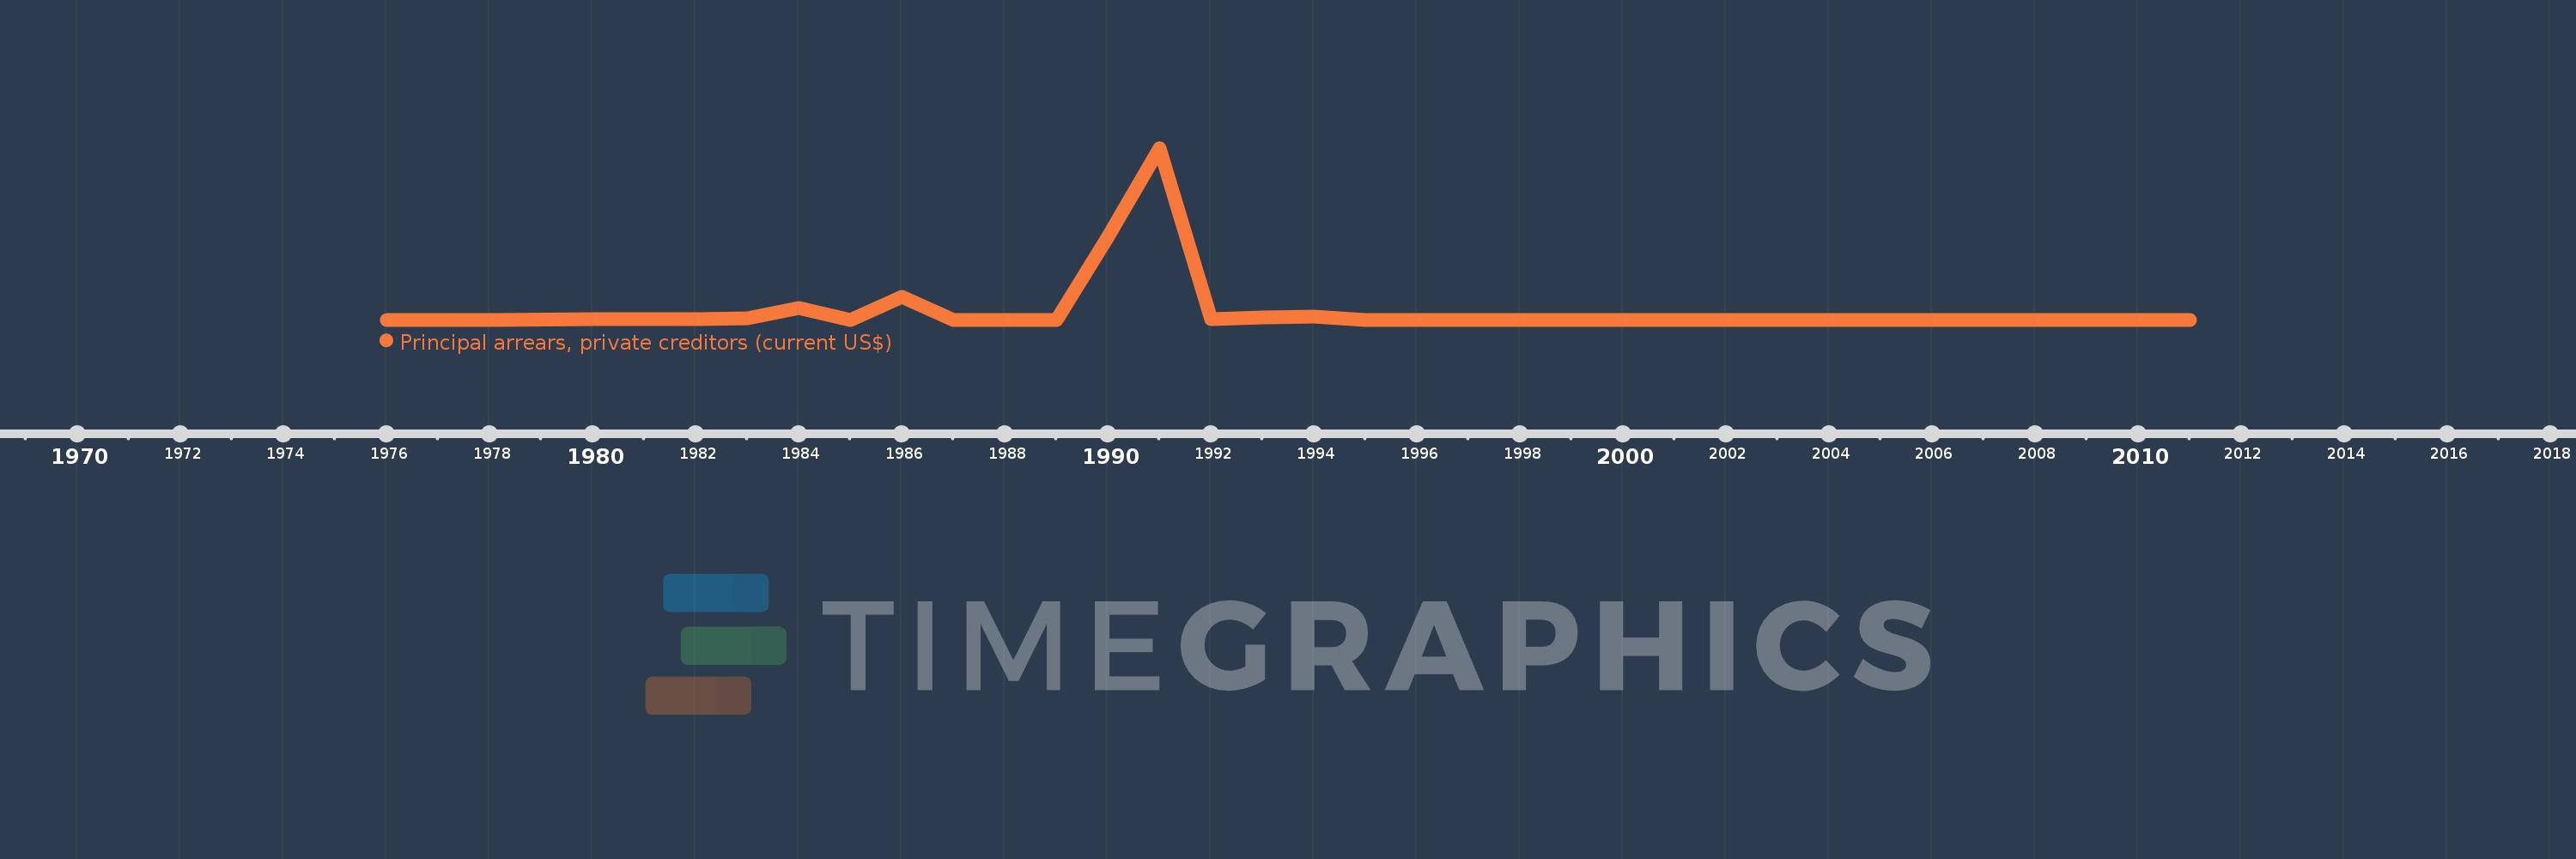
Principal arrears, private creditors (current US$)
2011,2010,2009,2008,2007,2006,2005,2004,2003,2002,1995,1994,1993,1992,1991,1990,1989,1988,1987,1986,1985,1984,1983,1982,1981,1980,1978,1977,1976
This statistics in other country:
Timeline:
This timeline shows a graph from 1976 to 2011 of Niger. No data until 1975. Number of actual observations by date: 29.
Source name:
World Development Indicators
Source organization:
World Bank, International Debt Statistics.
Categories, topics:
External Debt
Last updated:
apr 23, 2017
Indicators value changes by year
Maximum:
41.0 mln
jan 1, 1991
At the date of observation
Value
Absolute change
Change from previous value
jan 1, 1976
38.0K
+38.0K
0.0%
jan 1, 1977
0.0
-38.0K
-100.0%
jan 1, 1980
188.0K
+188.0K
%
jan 1, 1981
44.0K
-144.0K
-76.6%
jan 1, 1982
237.0K
+193.0K
438.64%
jan 1, 1983
371.0K
+134.0K
56.54%
jan 1, 1984
2.711 mln
+2.34 mln
630.73%
jan 1, 1985
0.0
-2.711 mln
-100.0%
jan 1, 1986
5.437 mln
+5.437 mln
%
jan 1, 1987
0.0
-5.437 mln
-100.0%
jan 1, 1990
19.779 mln
+19.779 mln
%
jan 1, 1991
41.0 mln
+21.221 mln
107.29%
jan 1, 1992
215.0K
-40.785 mln
-99.48%
jan 1, 1993
519.0K
+304.0K
141.4%
jan 1, 1994
846.0K
+327.0K
63.01%
jan 1, 1995
0.0
-846.0K
-100.0%
Ranking of countries by current statistics by years


Comments: