29
/
en
AIzaSyAYiBZKx7MnpbEhh9jyipgxe19OcubqV5w
April 1, 2024
227210
Qatar
QAT
true
2
1
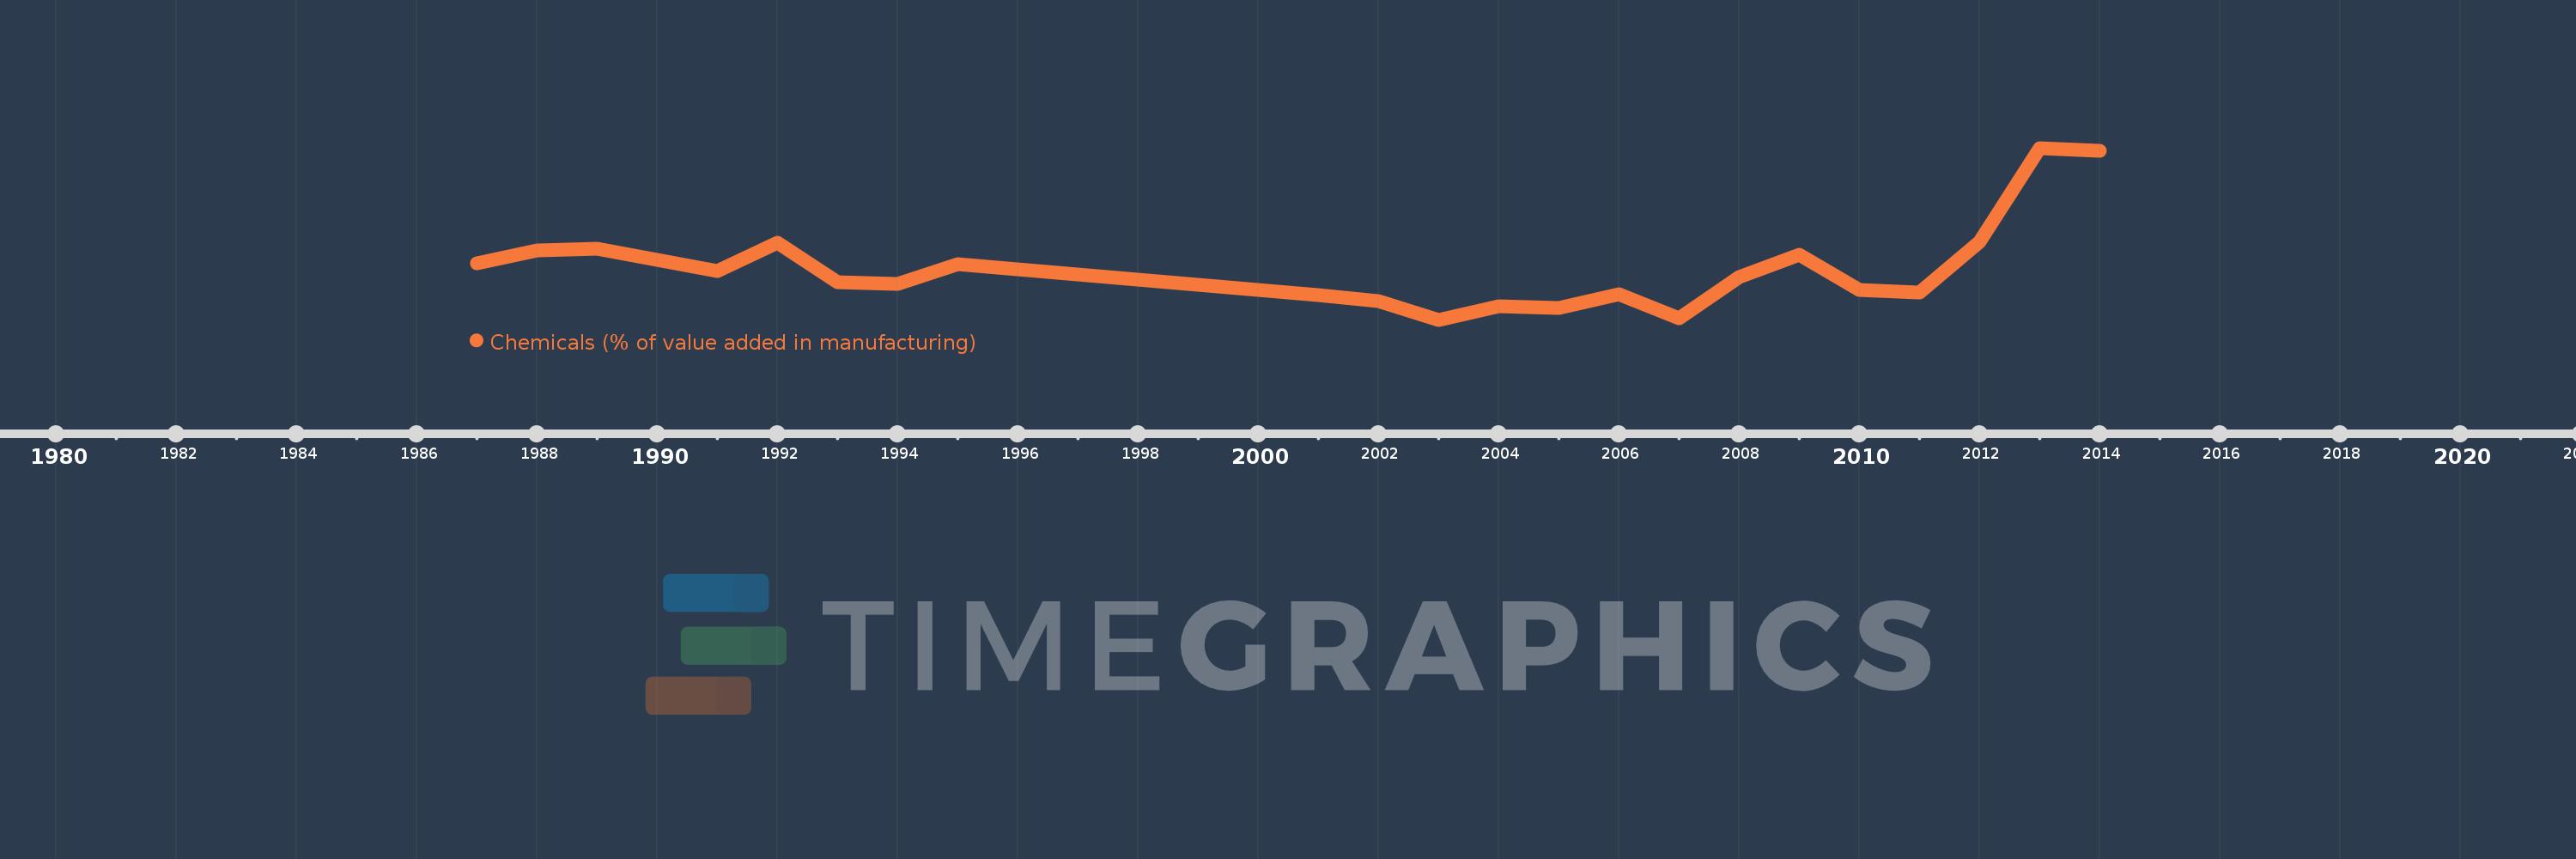
Chemicals (% of value added in manufacturing)
2014,2013,2012,2011,2010,2009,2008,2007,2006,2005,2004,2003,2002,2001,1995,1994,1993,1992,1991,1989,1988,1987
This statistics in other country:
AlbaniaAlgeriaArgentinaAustraliaAustriaAzerbaijanBahamas, TheBahrainBangladeshBarbadosBelarusBelgiumBelizeBeninBoliviaBosnia and HerzegovinaBotswanaBrazilBulgariaBurkina FasoBurundiCambodiaCameroonCanadaCentral African RepublicChileChinaColombiaCongo, Rep.Costa RicaCote d'IvoireCroatiaCubaCyprusCzech RepublicDenmarkDominican RepublicEcuadorEgypt, Arab Rep.El SalvadorEritreaEstoniaEthiopiaFijiFinlandFranceGabonGambia, TheGeorgiaGermanyGhanaGreeceGuatemalaHondurasHong Kong SAR, ChinaHungaryIcelandIndiaIndonesiaIran, Islamic Rep.IraqIrelandIsraelItalyJamaicaJapanJordanKazakhstanKenyaKorea, Rep.KuwaitKyrgyz RepublicLao PDRLatviaLebanonLesothoLibyaLithuaniaLuxembourgMacao SAR, ChinaMacedonia, FYRMadagascarMalawiMalaysiaMaltaMauritiusMexicoMongoliaMoroccoMozambiqueNamibiaNepalNetherlandsNew ZealandNicaraguaNigerNigeriaNorwayOmanPakistanPanamaPapua New GuineaParaguayPeruPhilippinesPolandPortugalPuerto RicoQatarRomaniaRussian FederationRwandaSaudi ArabiaSenegalSerbiaSierra LeoneSingaporeSlovak RepublicSloveniaSomaliaSouth AfricaSpainSri LankaSt. LuciaSudanSwazilandSwedenSwitzerlandSyrian Arab RepublicTanzaniaThailandTongaTrinidad and TobagoTunisiaTurkeyUgandaUkraineUnited Arab EmiratesUnited KingdomUnited StatesUruguayVenezuela, RBVietnamWest Bank and GazaYemen, Rep.Zambia Timeline:
This timeline shows a graph from 1987 to 2014 of Qatar. No data until 1986. Number of actual observations by date: 22.
Source name:
World Development Indicators
Source organization:
United Nations Industrial Development Organization, International Yearbook of Industrial Statistics.
Categories, topics:
Economy & Growth
Last updated:
apr 23, 2017
Indicators value changes by year
Minimum:
14.548
jan 1, 2003
Maximum:
62.363
jan 1, 2013
At the date of observation
Value
Absolute change
Change from previous value
jan 1, 1987
30.182
+30.182
0.0%
jan 1, 1988
33.841
+3.659
12.12%
jan 1, 1989
34.269
+0.428
1.27%
jan 1, 1991
28.059
-6.21
-18.12%
jan 1, 1992
35.875
+7.816
27.85%
jan 1, 1993
24.922
-10.953
-30.53%
jan 1, 1994
24.513
-0.409
-1.64%
jan 1, 1995
30.078
+5.565
22.7%
jan 1, 2001
21.446
-8.632
-28.7%
jan 1, 2002
19.711
-1.735
-8.09%
jan 1, 2003
14.548
-5.163
-26.19%
jan 1, 2004
18.199
+3.651
25.09%
jan 1, 2005
17.766
-0.433
-2.38%
jan 1, 2006
21.572
+3.806
21.42%
jan 1, 2007
14.842
-6.73
-31.2%
jan 1, 2008
26.346
+11.504
77.51%
jan 1, 2009
32.59
+6.244
23.7%
jan 1, 2010
22.87
-9.72
-29.83%
jan 1, 2011
22.08
-0.789
-3.45%
jan 1, 2012
36.305
+14.225
64.42%
jan 1, 2013
62.363
+26.058
71.77%
jan 1, 2014
61.56
-0.803
-1.29%
Ranking of countries by current statistics by years


Comments: