29
/
en
AIzaSyAYiBZKx7MnpbEhh9jyipgxe19OcubqV5w
April 1, 2024
181888
Luxembourg
LUX
true
2
1
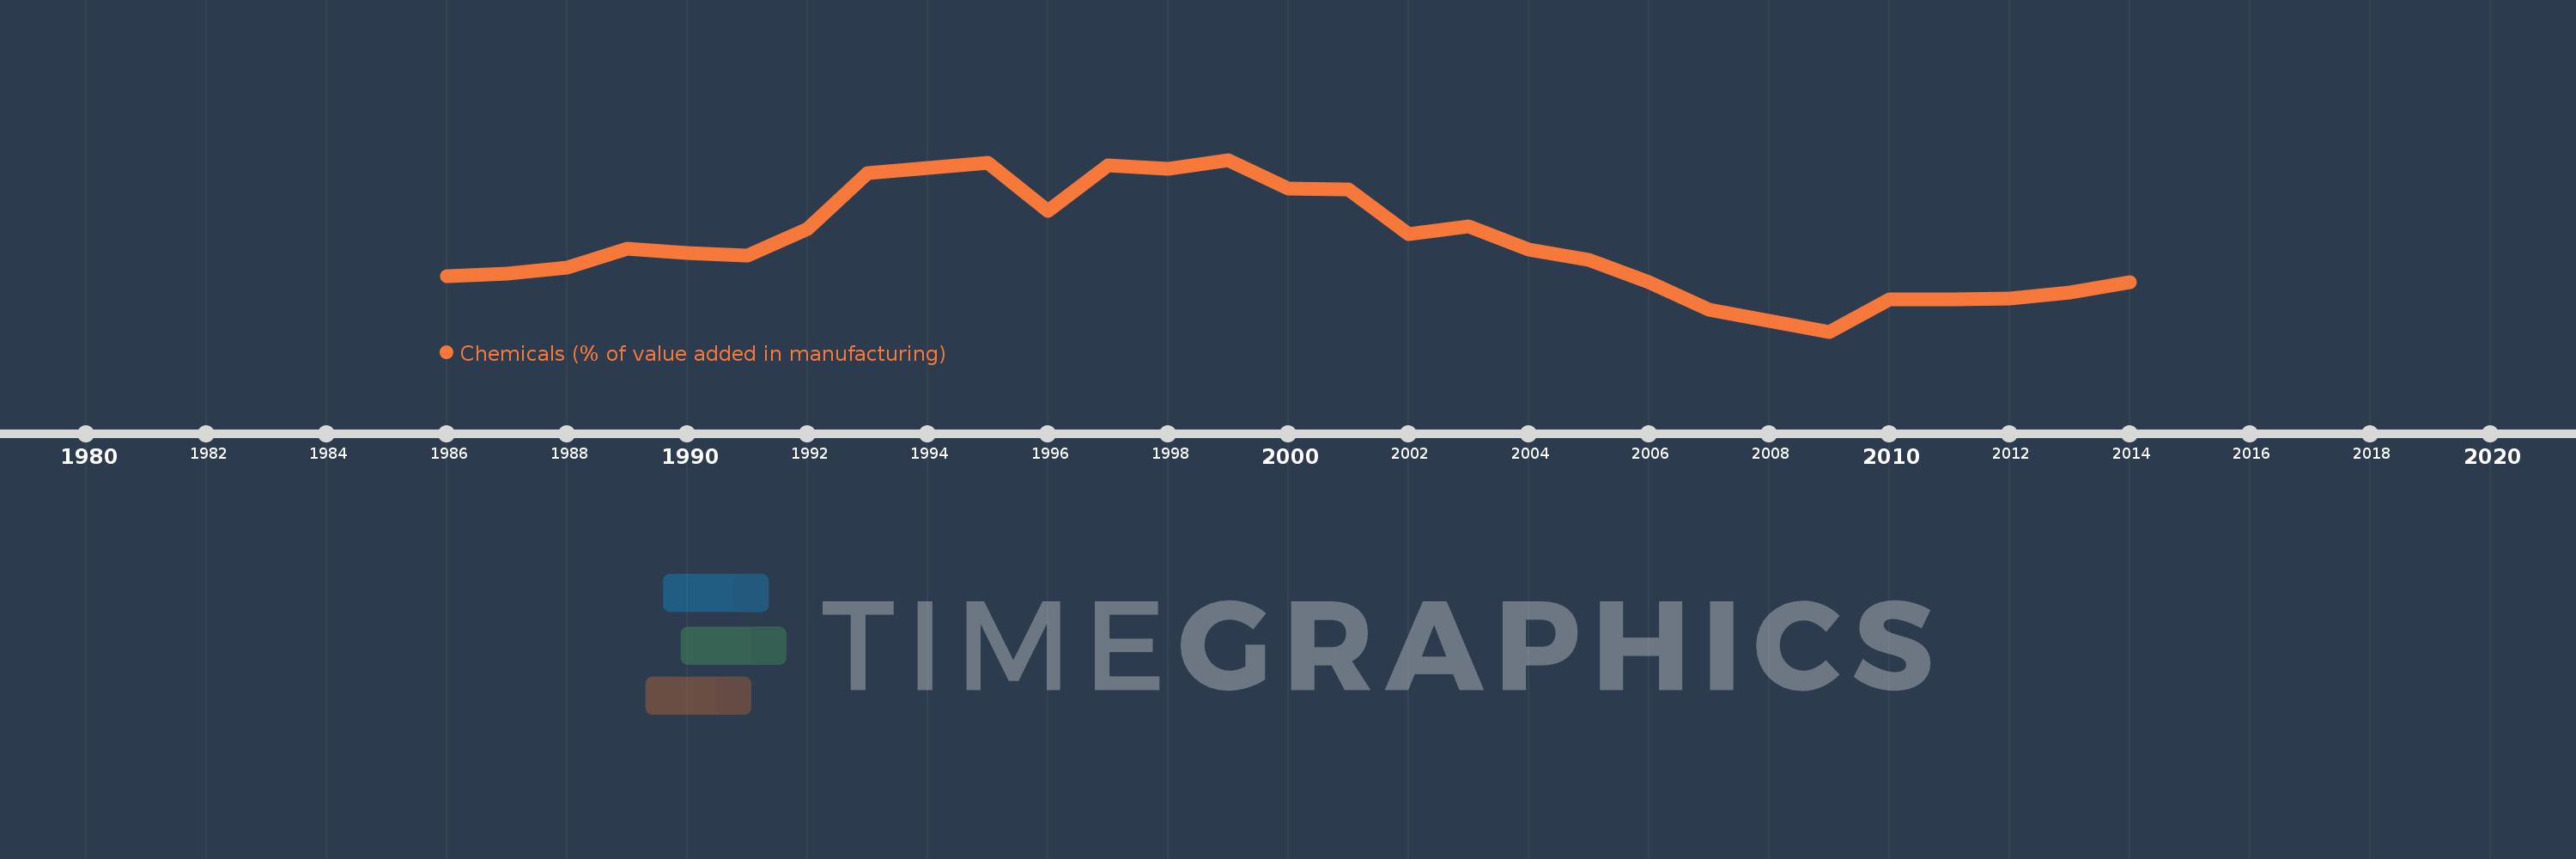
Chemicals (% of value added in manufacturing)
2014,2013,2012,2011,2010,2009,2008,2007,2006,2005,2004,2003,2002,2001,2000,1999,1998,1997,1996,1995,1994,1993,1992,1991,1990,1989,1988,1987,1986
This statistics in other country:
AlbaniaAlgeriaArgentinaAustraliaAustriaAzerbaijanBahamas, TheBahrainBangladeshBarbadosBelarusBelgiumBelizeBeninBoliviaBosnia and HerzegovinaBotswanaBrazilBulgariaBurkina FasoBurundiCambodiaCameroonCanadaCentral African RepublicChileChinaColombiaCongo, Rep.Costa RicaCote d'IvoireCroatiaCubaCyprusCzech RepublicDenmarkDominican RepublicEcuadorEgypt, Arab Rep.El SalvadorEritreaEstoniaEthiopiaFijiFinlandFranceGabonGambia, TheGeorgiaGermanyGhanaGreeceGuatemalaHondurasHong Kong SAR, ChinaHungaryIcelandIndiaIndonesiaIran, Islamic Rep.IraqIrelandIsraelItalyJamaicaJapanJordanKazakhstanKenyaKorea, Rep.KuwaitKyrgyz RepublicLao PDRLatviaLebanonLesothoLibyaLithuaniaLuxembourgMacao SAR, ChinaMacedonia, FYRMadagascarMalawiMalaysiaMaltaMauritiusMexicoMongoliaMoroccoMozambiqueNamibiaNepalNetherlandsNew ZealandNicaraguaNigerNigeriaNorwayOmanPakistanPanamaPapua New GuineaParaguayPeruPhilippinesPolandPortugalPuerto RicoQatarRomaniaRussian FederationRwandaSaudi ArabiaSenegalSerbiaSierra LeoneSingaporeSlovak RepublicSloveniaSomaliaSouth AfricaSpainSri LankaSt. LuciaSudanSwazilandSwedenSwitzerlandSyrian Arab RepublicTanzaniaThailandTongaTrinidad and TobagoTunisiaTurkeyUgandaUkraineUnited Arab EmiratesUnited KingdomUnited StatesUruguayVenezuela, RBVietnamWest Bank and GazaYemen, Rep.Zambia Timeline:
This timeline shows a graph from 1986 to 2014 of Luxembourg. No data until 1985. Number of actual observations by date: 29.
Source name:
World Development Indicators
Source organization:
United Nations Industrial Development Organization, International Yearbook of Industrial Statistics.
Categories, topics:
Economy & Growth
Last updated:
apr 23, 2017
Indicators value changes by year
At the date of observation
Value
Absolute change
Change from previous value
jan 1, 1986
2.97
+2.97
0.0%
jan 1, 1987
3.071
+0.101
3.41%
jan 1, 1988
3.315
+0.244
7.94%
jan 1, 1989
4.019
+0.703
21.22%
jan 1, 1990
3.857
-0.162
-4.03%
jan 1, 1991
3.749
-0.108
-2.8%
jan 1, 1992
4.745
+0.996
26.57%
jan 1, 1993
6.845
+2.1
44.26%
jan 1, 1994
7.034
+0.189
2.76%
jan 1, 1995
7.236
+0.202
2.87%
jan 1, 1996
5.425
-1.811
-25.02%
jan 1, 1997
7.151
+1.726
31.81%
jan 1, 1998
7.009
-0.142
-1.98%
jan 1, 1999
7.353
+0.344
4.91%
jan 1, 2000
6.257
-1.095
-14.9%
jan 1, 2001
6.227
-0.03
-0.48%
jan 1, 2002
4.563
-1.665
-26.73%
jan 1, 2003
4.868
+0.305
6.69%
jan 1, 2004
3.997
-0.871
-17.89%
jan 1, 2005
3.606
-0.391
-9.78%
jan 1, 2006
2.768
-0.838
-23.24%
jan 1, 2007
1.709
-1.059
-38.27%
jan 1, 2008
1.317
-0.392
-22.95%
jan 1, 2009
0.902
-0.414
-31.46%
jan 1, 2010
2.118
+1.215
134.66%
jan 1, 2011
2.11
-0.007
-0.34%
jan 1, 2012
2.159
+0.048
2.3%
jan 1, 2013
2.37
+0.211
9.79%
jan 1, 2014
2.762
+0.391
16.52%
Ranking of countries by current statistics by years


Comments: