29
/
en
AIzaSyAYiBZKx7MnpbEhh9jyipgxe19OcubqV5w
April 1, 2024
219364
Papua New Guinea
PNG
true
2
1
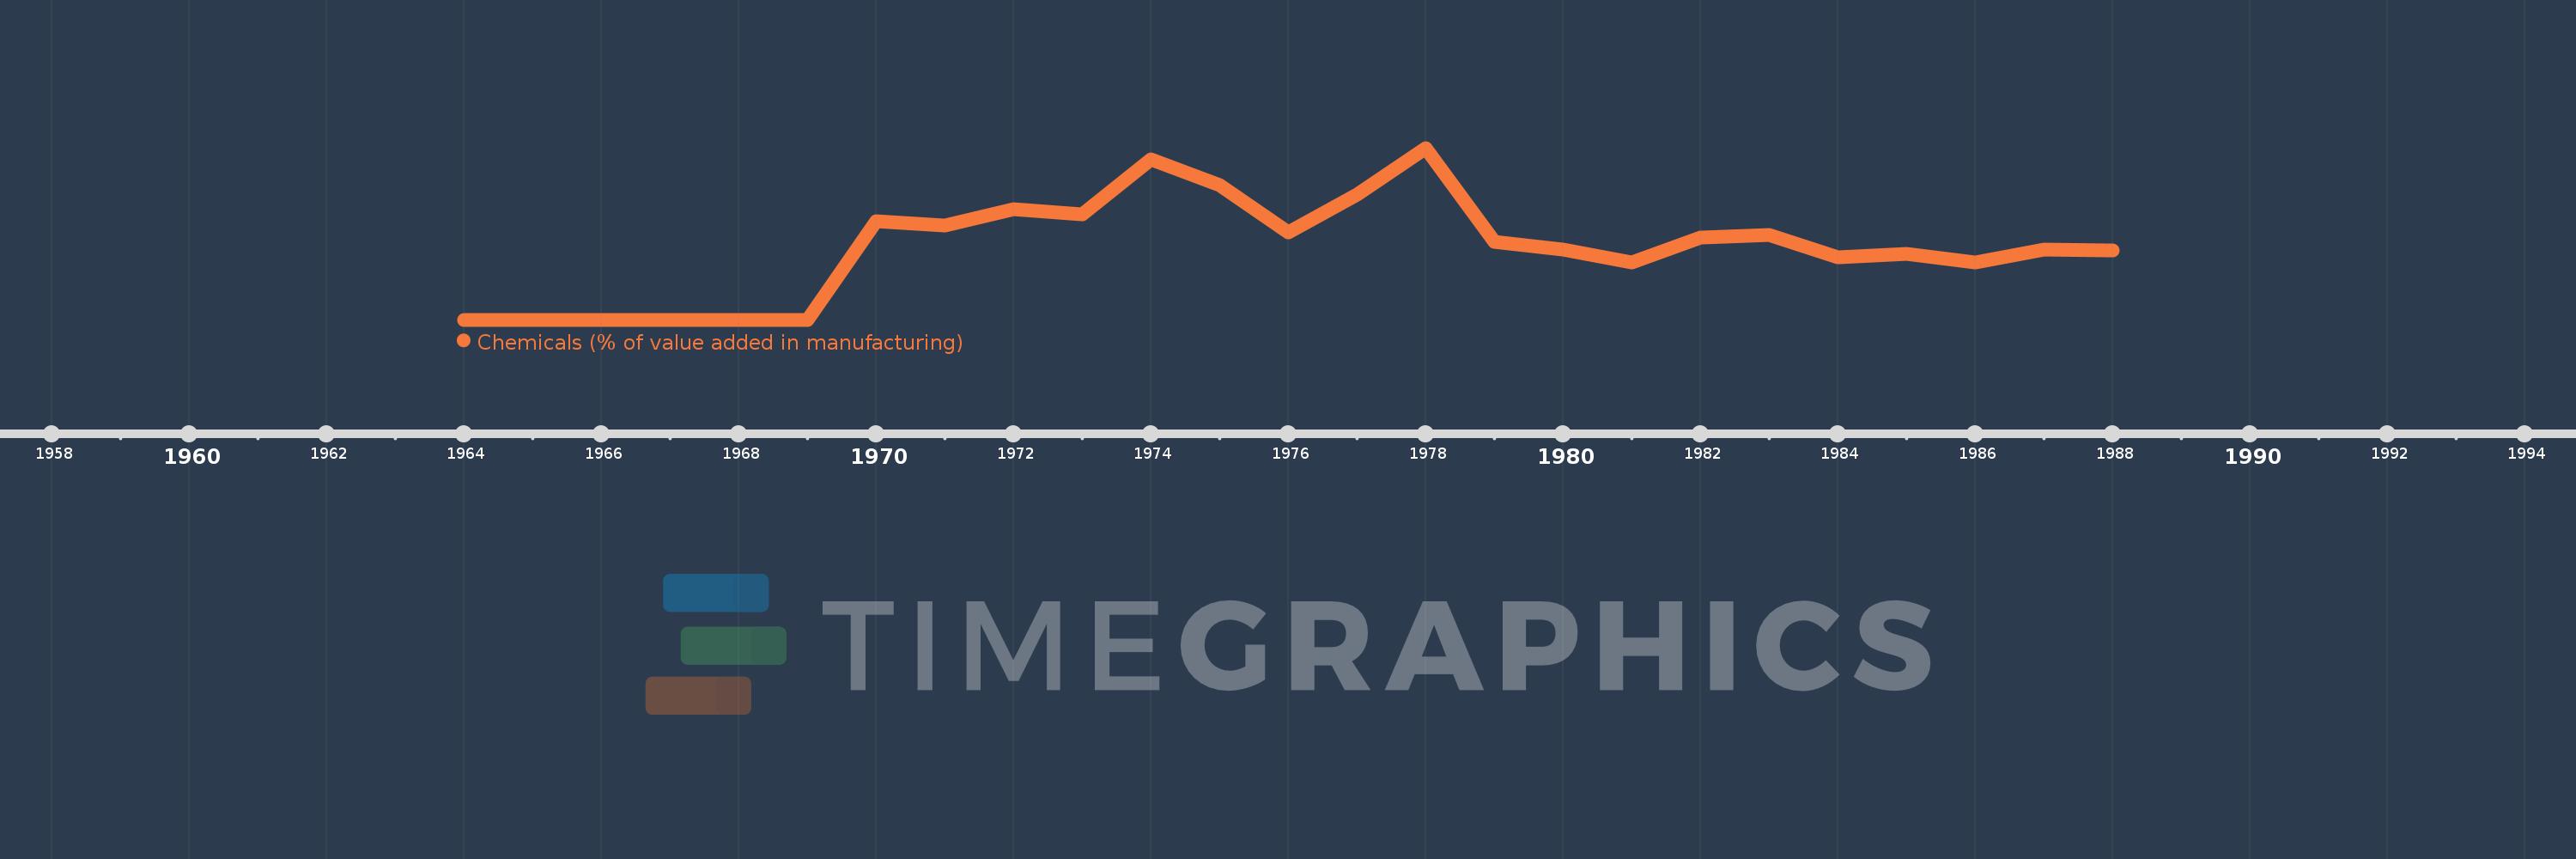
Chemicals (% of value added in manufacturing)
1988,1987,1986,1985,1984,1983,1982,1981,1980,1979,1978,1977,1976,1975,1974,1973,1972,1971,1970,1969,1968,1967,1966,1965,1964
This statistics in other country:
AlbaniaAlgeriaArgentinaAustraliaAustriaAzerbaijanBahamas, TheBahrainBangladeshBarbadosBelarusBelgiumBelizeBeninBoliviaBosnia and HerzegovinaBotswanaBrazilBulgariaBurkina FasoBurundiCambodiaCameroonCanadaCentral African RepublicChileChinaColombiaCongo, Rep.Costa RicaCote d'IvoireCroatiaCubaCyprusCzech RepublicDenmarkDominican RepublicEcuadorEgypt, Arab Rep.El SalvadorEritreaEstoniaEthiopiaFijiFinlandFranceGabonGambia, TheGeorgiaGermanyGhanaGreeceGuatemalaHondurasHong Kong SAR, ChinaHungaryIcelandIndiaIndonesiaIran, Islamic Rep.IraqIrelandIsraelItalyJamaicaJapanJordanKazakhstanKenyaKorea, Rep.KuwaitKyrgyz RepublicLao PDRLatviaLebanonLesothoLibyaLithuaniaLuxembourgMacao SAR, ChinaMacedonia, FYRMadagascarMalawiMalaysiaMaltaMauritiusMexicoMongoliaMoroccoMozambiqueNamibiaNepalNetherlandsNew ZealandNicaraguaNigerNigeriaNorwayOmanPakistanPanamaPapua New GuineaParaguayPeruPhilippinesPolandPortugalPuerto RicoQatarRomaniaRussian FederationRwandaSaudi ArabiaSenegalSerbiaSierra LeoneSingaporeSlovak RepublicSloveniaSomaliaSouth AfricaSpainSri LankaSt. LuciaSudanSwazilandSwedenSwitzerlandSyrian Arab RepublicTanzaniaThailandTongaTrinidad and TobagoTunisiaTurkeyUgandaUkraineUnited Arab EmiratesUnited KingdomUnited StatesUruguayVenezuela, RBVietnamWest Bank and GazaYemen, Rep.Zambia Timeline:
This timeline shows a graph from 1964 to 1988 of Papua New Guinea. No data until 1963. Number of actual observations by date: 25.
Source name:
World Development Indicators
Source organization:
United Nations Industrial Development Organization, International Yearbook of Industrial Statistics.
Categories, topics:
Economy & Growth
Last updated:
apr 23, 2017
Indicators value changes by year
At the date of observation
Value
Absolute change
Change from previous value
jan 1, 1970
4.617
+4.617
%
jan 1, 1971
4.425
-0.192
-4.16%
jan 1, 1972
5.183
+0.758
17.13%
jan 1, 1973
4.962
-0.222
-4.28%
jan 1, 1974
7.535
+2.573
51.87%
jan 1, 1975
6.322
-1.213
-16.1%
jan 1, 1976
4.12
-2.202
-34.83%
jan 1, 1977
5.893
+1.773
43.04%
jan 1, 1978
8.082
+2.189
37.14%
jan 1, 1979
3.661
-4.421
-54.7%
jan 1, 1980
3.286
-0.376
-10.26%
jan 1, 1981
2.694
-0.592
-18.01%
jan 1, 1982
3.861
+1.167
43.33%
jan 1, 1983
3.987
+0.125
3.25%
jan 1, 1984
2.925
-1.061
-26.63%
jan 1, 1985
3.115
+0.19
6.49%
jan 1, 1986
2.706
-0.409
-13.14%
jan 1, 1987
3.308
+0.602
22.24%
jan 1, 1988
3.252
-0.055
-1.68%
Ranking of countries by current statistics by years


Comments: