29
/
en
AIzaSyAYiBZKx7MnpbEhh9jyipgxe19OcubqV5w
April 1, 2024
208271
Netherlands
NLD
true
2
1
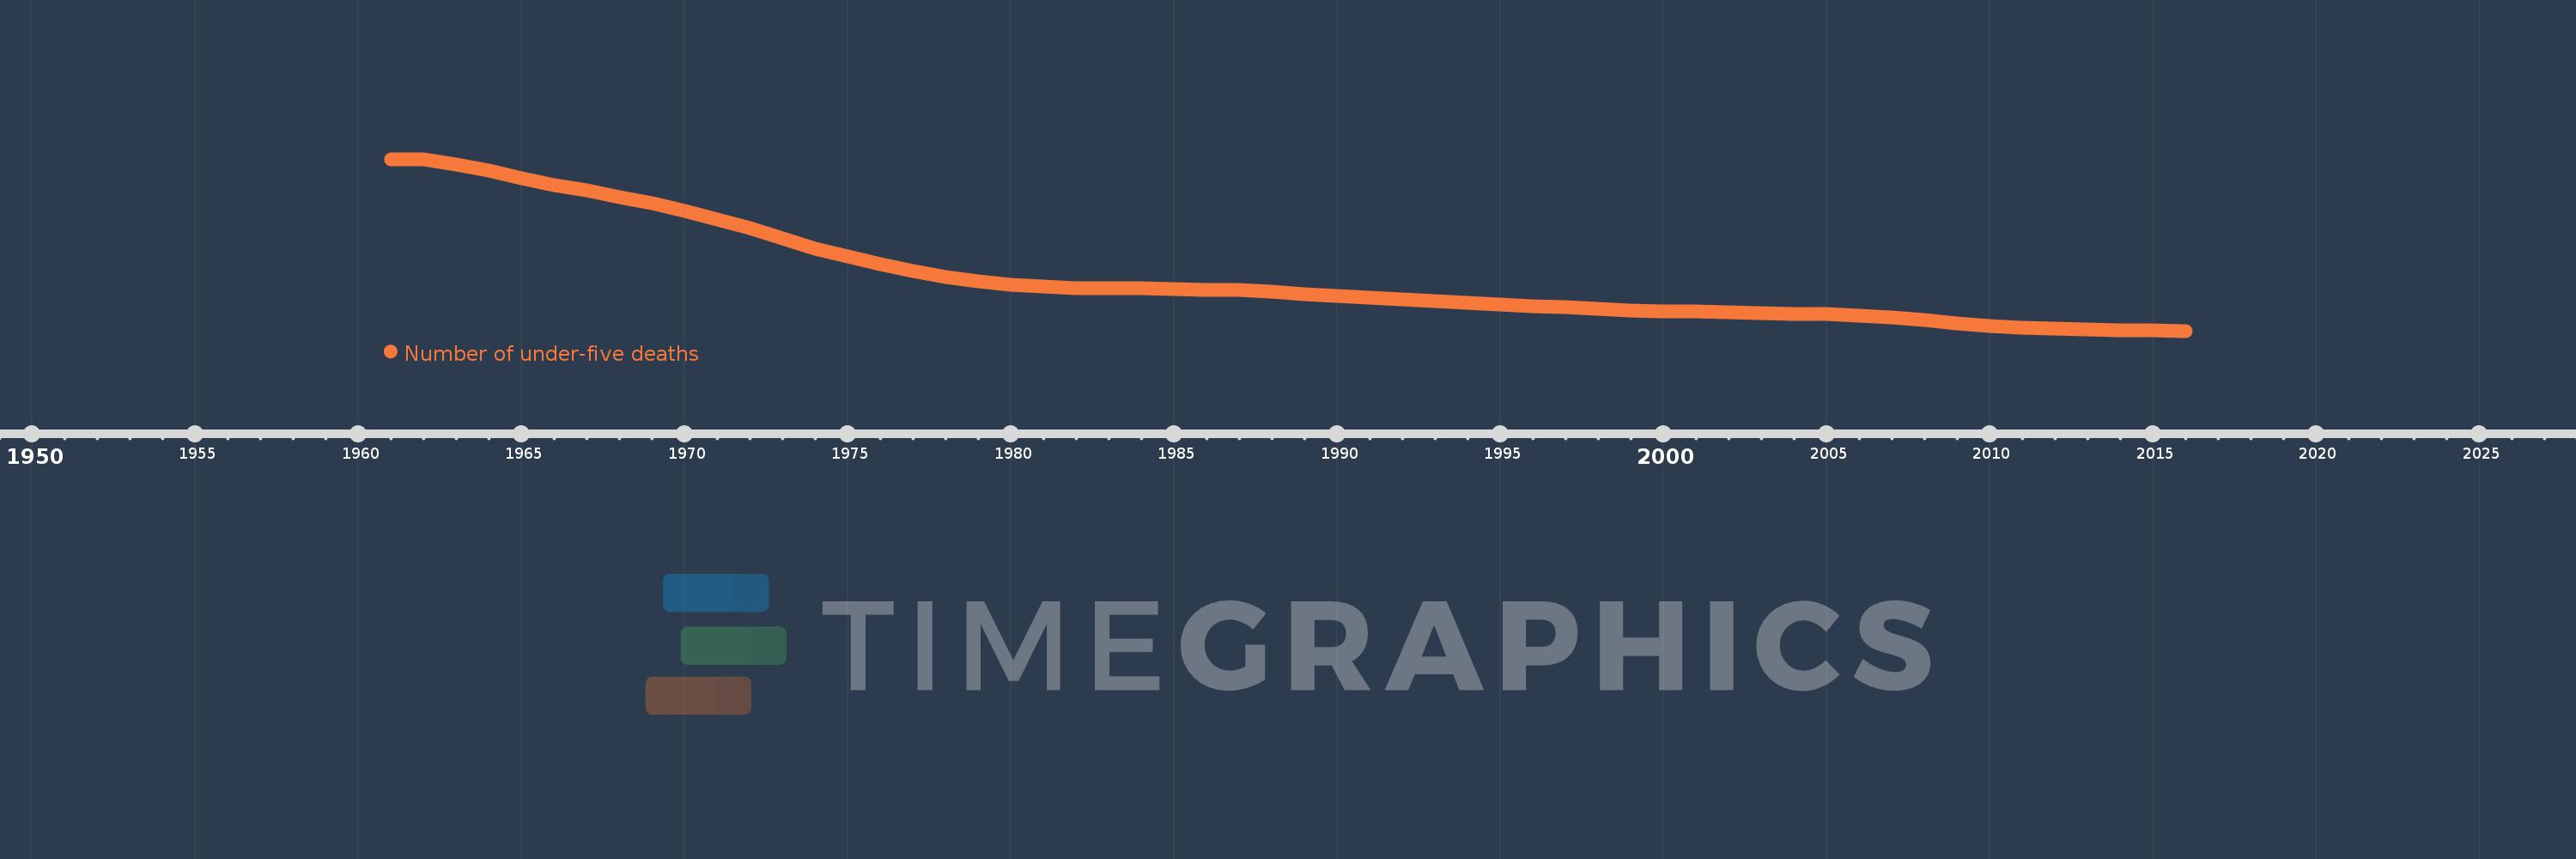
Number of under-five deaths
2016,2015,2014,2013,2012,2011,2010,2009,2008,2007,2006,2005,2004,2003,2002,2001,2000,1999,1998,1997,1996,1995,1994,1993,1992,1991,1990,1989,1988,1987,1986,1985,1984,1983,1982,1981,1980,1979,1978,1977,1976,1975,1974,1973,1972,1971,1970,1969,1968,1967,1966,1965,1964,1963,1962,1961
This statistics in other country:
AfghanistanAlbaniaAlgeriaAndorraAngolaAntigua and BarbudaArgentinaArmeniaAustraliaAustriaAzerbaijanBahamas, TheBahrainBangladeshBarbadosBelarusBelgiumBelizeBeninBhutanBoliviaBosnia and HerzegovinaBotswanaBrazilBrunei DarussalamBulgariaBurkina FasoBurundiCabo VerdeCambodiaCameroonCanadaCentral African RepublicChadChileChinaColombiaComorosCongo, Dem. Rep.Congo, Rep.Costa RicaCote d'IvoireCroatiaCubaCyprusCzech RepublicDenmarkDjiboutiDominicaDominican RepublicEast Asia & Pacific (excluding high income)EcuadorEgypt, Arab Rep.El SalvadorEquatorial GuineaEritreaEstoniaEthiopiaEurope & Central Asia (excluding high income)FijiFinlandFranceGabonGambia, TheGeorgiaGermanyGhanaGreeceGrenadaGuatemalaGuineaGuinea-BissauGuyanaHaitiHigh incomeHondurasHungaryIcelandIndiaIndonesiaIran, Islamic Rep.IraqIrelandIsraelItalyJamaicaJapanJordanKazakhstanKenyaKiribatiKorea, Dem. People’s Rep.Korea, Rep.KuwaitKyrgyz RepublicLao PDRLatin America & Caribbean (excluding high income)LatviaLebanonLesothoLiberiaLibyaLithuaniaLow & middle incomeLow incomeLower middle incomeLuxembourgMacedonia, FYRMadagascarMalawiMalaysiaMaldivesMaliMaltaMarshall IslandsMauritaniaMauritiusMexicoMicronesia, Fed. Sts.Middle East & North Africa (excluding high income)Middle incomeMoldovaMonacoMongoliaMontenegroMoroccoMozambiqueMyanmarNamibiaNauruNepalNetherlandsNew ZealandNicaraguaNigerNigeriaNorwayOmanPakistanPalauPanamaPapua New GuineaParaguayPeruPhilippinesPolandPortugalQatarRomaniaRussian FederationRwandaSamoaSan MarinoSao Tome and PrincipeSaudi ArabiaSenegalSerbiaSeychellesSierra LeoneSingaporeSlovak RepublicSloveniaSolomon IslandsSomaliaSouth AfricaSouth AsiaSouth SudanSpainSri LankaSt. Kitts and NevisSt. LuciaSt. Vincent and the GrenadinesSub-Saharan Africa (excluding high income)SudanSurinameSwazilandSwedenSwitzerlandSyrian Arab RepublicTajikistanTanzaniaThailandTimor-LesteTogoTongaTrinidad and TobagoTunisiaTurkeyTurkmenistanTuvaluUgandaUkraineUnited Arab EmiratesUnited KingdomUnited StatesUpper middle incomeUruguayUzbekistanVanuatuVenezuela, RBVietnamWest Bank and GazaWorldYemen, Rep.ZambiaZimbabwe Timeline:
This timeline shows a graph from 1961 to 2016 of Netherlands. No data until 1960. Number of actual observations by date: 56.
Source name:
World Development Indicators
Source organization:
Estimates developed by the UN Inter-agency Group for Child Mortality Estimation (UNICEF, WHO, World Bank, UN DESA Population Division) at www.childmortality.org.
Categories, topics:
Health
Last updated:
apr 23, 2017
Indicators value changes by year
Maximum:
5.288K
jan 1, 1962
At the date of observation
Value
Absolute change
Change from previous value
jan 1, 1961
5.281K
+5.281K
0.0%
jan 1, 1962
5.288K
+7.0
0.13%
jan 1, 1963
5.152K
-136.0
-2.57%
jan 1, 1964
4.993K
-159.0
-3.09%
jan 1, 1965
4.785K
-208.0
-4.17%
jan 1, 1966
4.592K
-193.0
-4.03%
jan 1, 1967
4.446K
-146.0
-3.18%
jan 1, 1968
4.276K
-170.0
-3.82%
jan 1, 1969
4.101K
-175.0
-4.09%
jan 1, 1970
3.908K
-193.0
-4.71%
jan 1, 1971
3.67K
-238.0
-6.09%
jan 1, 1972
3.435K
-235.0
-6.4%
jan 1, 1973
3.166K
-269.0
-7.83%
jan 1, 1974
2.897K
-269.0
-8.5%
jan 1, 1975
2.669K
-228.0
-7.87%
jan 1, 1976
2.467K
-202.0
-7.57%
jan 1, 1977
2.286K
-181.0
-7.34%
jan 1, 1978
2.135K
-151.0
-6.61%
jan 1, 1979
2.01K
-125.0
-5.85%
jan 1, 1980
1.922K
-88.0
-4.38%
jan 1, 1981
1.865K
-57.0
-2.97%
jan 1, 1982
1.827K
-38.0
-2.04%
jan 1, 1983
1.82K
-7.0
-0.38%
jan 1, 1984
1.82K
0.0
0.0%
jan 1, 1985
1.8K
-20.0
-1.1%
jan 1, 1986
1.792K
-8.0
-0.44%
jan 1, 1987
1.776K
-16.0
-0.89%
jan 1, 1988
1.73K
-46.0
-2.59%
jan 1, 1989
1.676K
-54.0
-3.12%
jan 1, 1990
1.622K
-54.0
-3.22%
jan 1, 1991
1.572K
-50.0
-3.08%
jan 1, 1992
1.526K
-46.0
-2.93%
jan 1, 1993
1.482K
-44.0
-2.88%
jan 1, 1994
1.438K
-44.0
-2.97%
jan 1, 1995
1.388K
-50.0
-3.48%
jan 1, 1996
1.353K
-35.0
-2.52%
jan 1, 1997
1.311K
-42.0
-3.1%
jan 1, 1998
1.265K
-46.0
-3.51%
jan 1, 1999
1.237K
-28.0
-2.21%
jan 1, 2000
1.213K
-24.0
-1.94%
jan 1, 2001
1.196K
-17.0
-1.4%
jan 1, 2002
1.188K
-8.0
-0.67%
jan 1, 2003
1.167K
-21.0
-1.77%
jan 1, 2004
1.147K
-20.0
-1.71%
jan 1, 2005
1.137K
-10.0
-0.87%
jan 1, 2006
1.093K
-44.0
-3.87%
jan 1, 2007
1.034K
-59.0
-5.4%
jan 1, 2008
963.0
-71.0
-6.87%
jan 1, 2009
888.0
-75.0
-7.79%
jan 1, 2010
821.0
-67.0
-7.55%
jan 1, 2011
765.0
-56.0
-6.82%
jan 1, 2012
739.0
-26.0
-3.4%
jan 1, 2013
725.0
-14.0
-1.89%
jan 1, 2014
699.0
-26.0
-3.59%
jan 1, 2015
692.0
-7.0
-1.0%
jan 1, 2016
682.0
-10.0
-1.45%
Ranking of countries by current statistics by years


Comments: