29
/
en
AIzaSyAYiBZKx7MnpbEhh9jyipgxe19OcubqV5w
April 1, 2024
266113
Tonga
TON
true
2
1
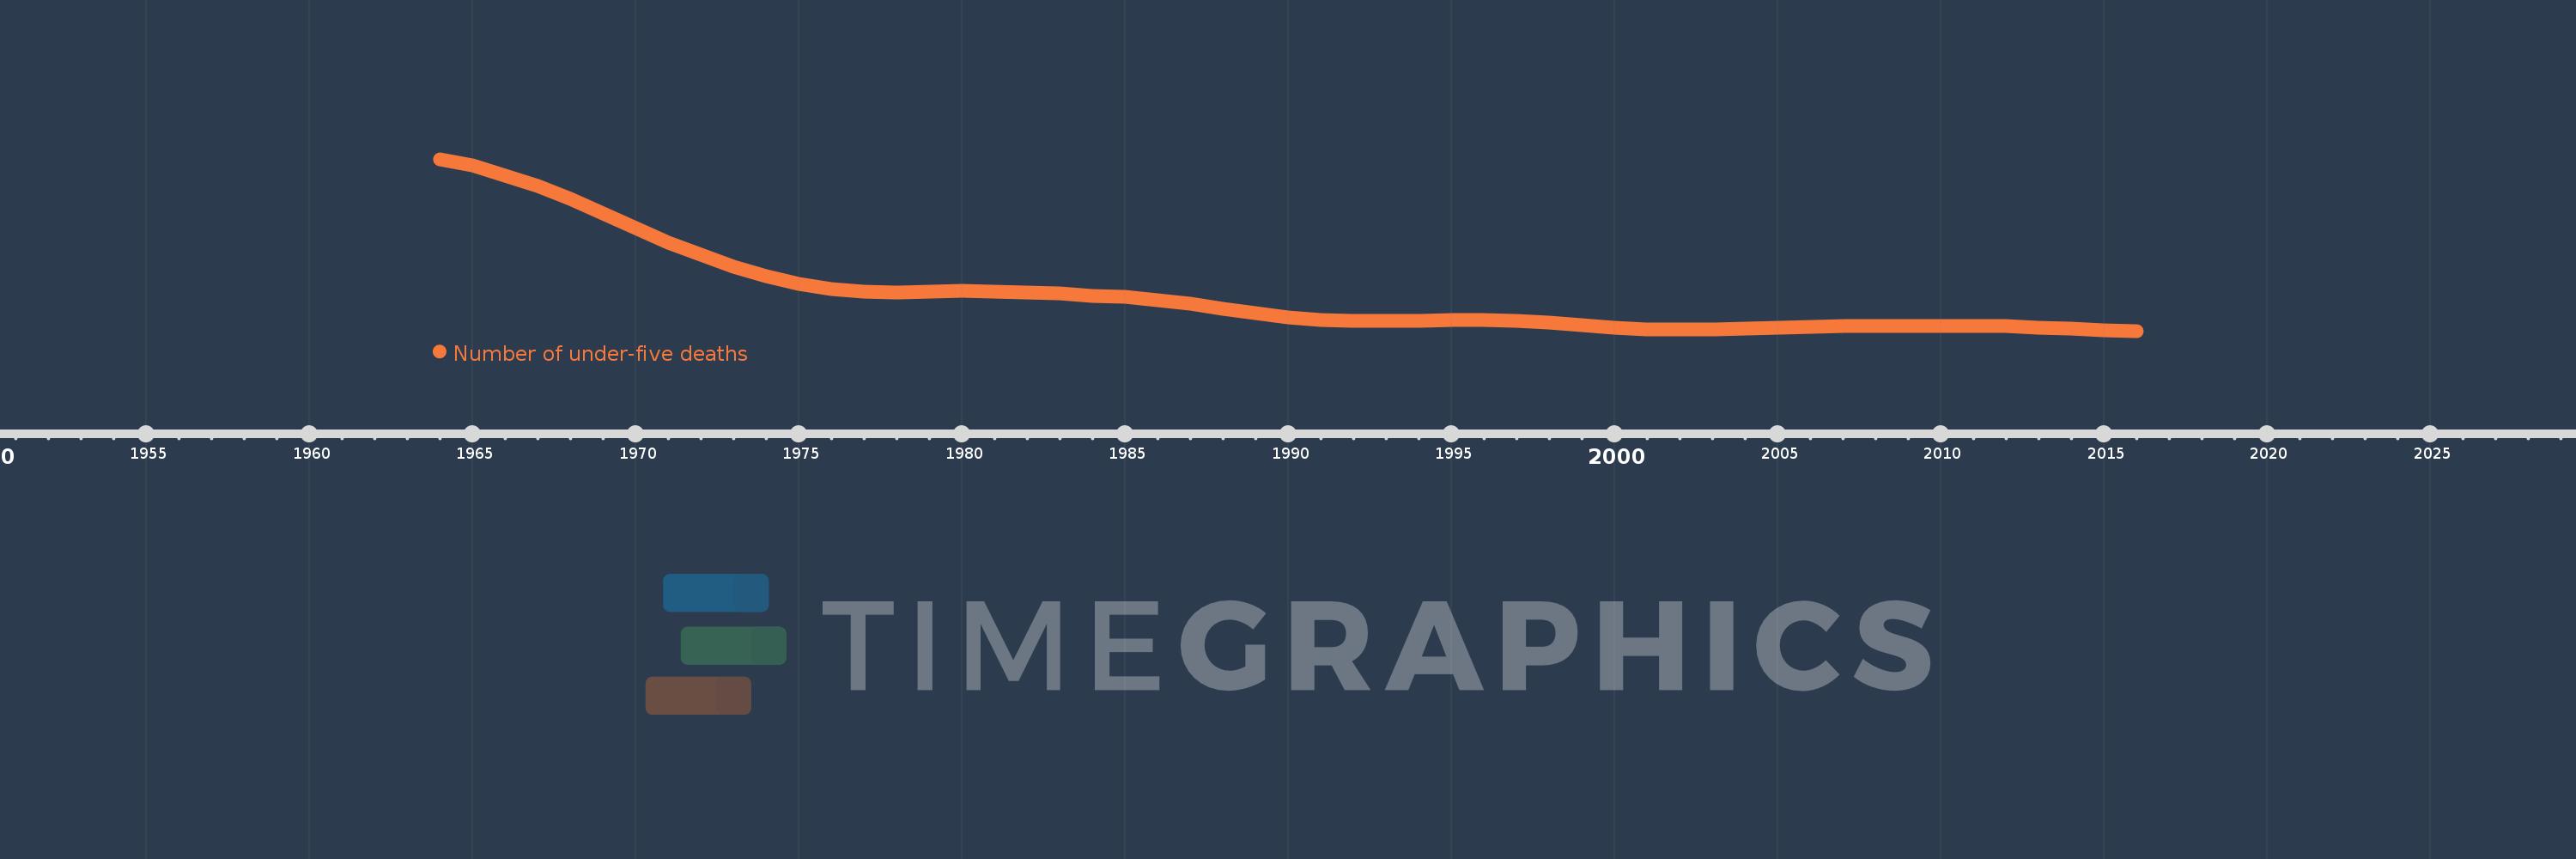
Number of under-five deaths
2016,2015,2014,2013,2012,2011,2010,2009,2008,2007,2006,2005,2004,2003,2002,2001,2000,1999,1998,1997,1996,1995,1994,1993,1992,1991,1990,1989,1988,1987,1986,1985,1984,1983,1982,1981,1980,1979,1978,1977,1976,1975,1974,1973,1972,1971,1970,1969,1968,1967,1966,1965,1964
This statistics in other country:
AfghanistanAlbaniaAlgeriaAndorraAngolaAntigua and BarbudaArgentinaArmeniaAustraliaAustriaAzerbaijanBahamas, TheBahrainBangladeshBarbadosBelarusBelgiumBelizeBeninBhutanBoliviaBosnia and HerzegovinaBotswanaBrazilBrunei DarussalamBulgariaBurkina FasoBurundiCabo VerdeCambodiaCameroonCanadaCentral African RepublicChadChileChinaColombiaComorosCongo, Dem. Rep.Congo, Rep.Costa RicaCote d'IvoireCroatiaCubaCyprusCzech RepublicDenmarkDjiboutiDominicaDominican RepublicEast Asia & Pacific (excluding high income)EcuadorEgypt, Arab Rep.El SalvadorEquatorial GuineaEritreaEstoniaEthiopiaEurope & Central Asia (excluding high income)FijiFinlandFranceGabonGambia, TheGeorgiaGermanyGhanaGreeceGrenadaGuatemalaGuineaGuinea-BissauGuyanaHaitiHigh incomeHondurasHungaryIcelandIndiaIndonesiaIran, Islamic Rep.IraqIrelandIsraelItalyJamaicaJapanJordanKazakhstanKenyaKiribatiKorea, Dem. People’s Rep.Korea, Rep.KuwaitKyrgyz RepublicLao PDRLatin America & Caribbean (excluding high income)LatviaLebanonLesothoLiberiaLibyaLithuaniaLow & middle incomeLow incomeLower middle incomeLuxembourgMacedonia, FYRMadagascarMalawiMalaysiaMaldivesMaliMaltaMarshall IslandsMauritaniaMauritiusMexicoMicronesia, Fed. Sts.Middle East & North Africa (excluding high income)Middle incomeMoldovaMonacoMongoliaMontenegroMoroccoMozambiqueMyanmarNamibiaNauruNepalNetherlandsNew ZealandNicaraguaNigerNigeriaNorwayOmanPakistanPalauPanamaPapua New GuineaParaguayPeruPhilippinesPolandPortugalQatarRomaniaRussian FederationRwandaSamoaSan MarinoSao Tome and PrincipeSaudi ArabiaSenegalSerbiaSeychellesSierra LeoneSingaporeSlovak RepublicSloveniaSolomon IslandsSomaliaSouth AfricaSouth AsiaSouth SudanSpainSri LankaSt. Kitts and NevisSt. LuciaSt. Vincent and the GrenadinesSub-Saharan Africa (excluding high income)SudanSurinameSwazilandSwedenSwitzerlandSyrian Arab RepublicTajikistanTanzaniaThailandTimor-LesteTogoTongaTrinidad and TobagoTunisiaTurkeyTurkmenistanTuvaluUgandaUkraineUnited Arab EmiratesUnited KingdomUnited StatesUpper middle incomeUruguayUzbekistanVanuatuVenezuela, RBVietnamWest Bank and GazaWorldYemen, Rep.ZambiaZimbabwe Timeline:
This timeline shows a graph from 1964 to 2016 of Tonga. No data until 1963. Number of actual observations by date: 53.
Source name:
World Development Indicators
Source organization:
Estimates developed by the UN Inter-agency Group for Child Mortality Estimation (UNICEF, WHO, World Bank, UN DESA Population Division) at www.childmortality.org.
Categories, topics:
Health
Last updated:
apr 23, 2017
Indicators value changes by year
At the date of observation
Value
Absolute change
Change from previous value
jan 1, 1964
257.0
+257.0
0.0%
jan 1, 1965
249.0
-8.0
-3.11%
jan 1, 1966
236.0
-13.0
-5.22%
jan 1, 1967
223.0
-13.0
-5.51%
jan 1, 1968
207.0
-16.0
-7.17%
jan 1, 1969
189.0
-18.0
-8.7%
jan 1, 1970
171.0
-18.0
-9.52%
jan 1, 1971
153.0
-18.0
-10.53%
jan 1, 1972
138.0
-15.0
-9.8%
jan 1, 1973
123.0
-15.0
-10.87%
jan 1, 1974
111.0
-12.0
-9.76%
jan 1, 1975
101.0
-10.0
-9.01%
jan 1, 1976
95.0
-6.0
-5.94%
jan 1, 1977
92.0
-3.0
-3.16%
jan 1, 1978
91.0
-1.0
-1.09%
jan 1, 1979
92.0
+1.0
1.1%
jan 1, 1980
93.0
+1.0
1.09%
jan 1, 1981
92.0
-1.0
-1.08%
jan 1, 1982
91.0
-1.0
-1.09%
jan 1, 1983
90.0
-1.0
-1.1%
jan 1, 1984
87.0
-3.0
-3.33%
jan 1, 1985
85.0
-2.0
-2.3%
jan 1, 1986
81.0
-4.0
-4.71%
jan 1, 1987
77.0
-4.0
-4.94%
jan 1, 1988
71.0
-6.0
-7.79%
jan 1, 1989
65.0
-6.0
-8.45%
jan 1, 1990
60.0
-5.0
-7.69%
jan 1, 1991
57.0
-3.0
-5.0%
jan 1, 1992
55.0
-2.0
-3.51%
jan 1, 1994
56.0
+1.0
1.82%
jan 1, 1995
57.0
+1.0
1.79%
jan 1, 1997
55.0
-2.0
-3.51%
jan 1, 1998
53.0
-2.0
-3.64%
jan 1, 1999
50.0
-3.0
-5.66%
jan 1, 2000
47.0
-3.0
-6.0%
jan 1, 2001
45.0
-2.0
-4.26%
jan 1, 2004
46.0
+1.0
2.22%
jan 1, 2005
47.0
+1.0
2.17%
jan 1, 2006
48.0
+1.0
2.13%
jan 1, 2007
49.0
+1.0
2.08%
jan 1, 2013
47.0
-2.0
-4.08%
jan 1, 2014
46.0
-1.0
-2.13%
jan 1, 2015
44.0
-2.0
-4.35%
jan 1, 2016
43.0
-1.0
-2.27%
Ranking of countries by current statistics by years


Comments: