29
/
en
AIzaSyAYiBZKx7MnpbEhh9jyipgxe19OcubqV5w
April 1, 2024
42754
Latin America & Caribbean (excluding high income)
LAC
false
2
1
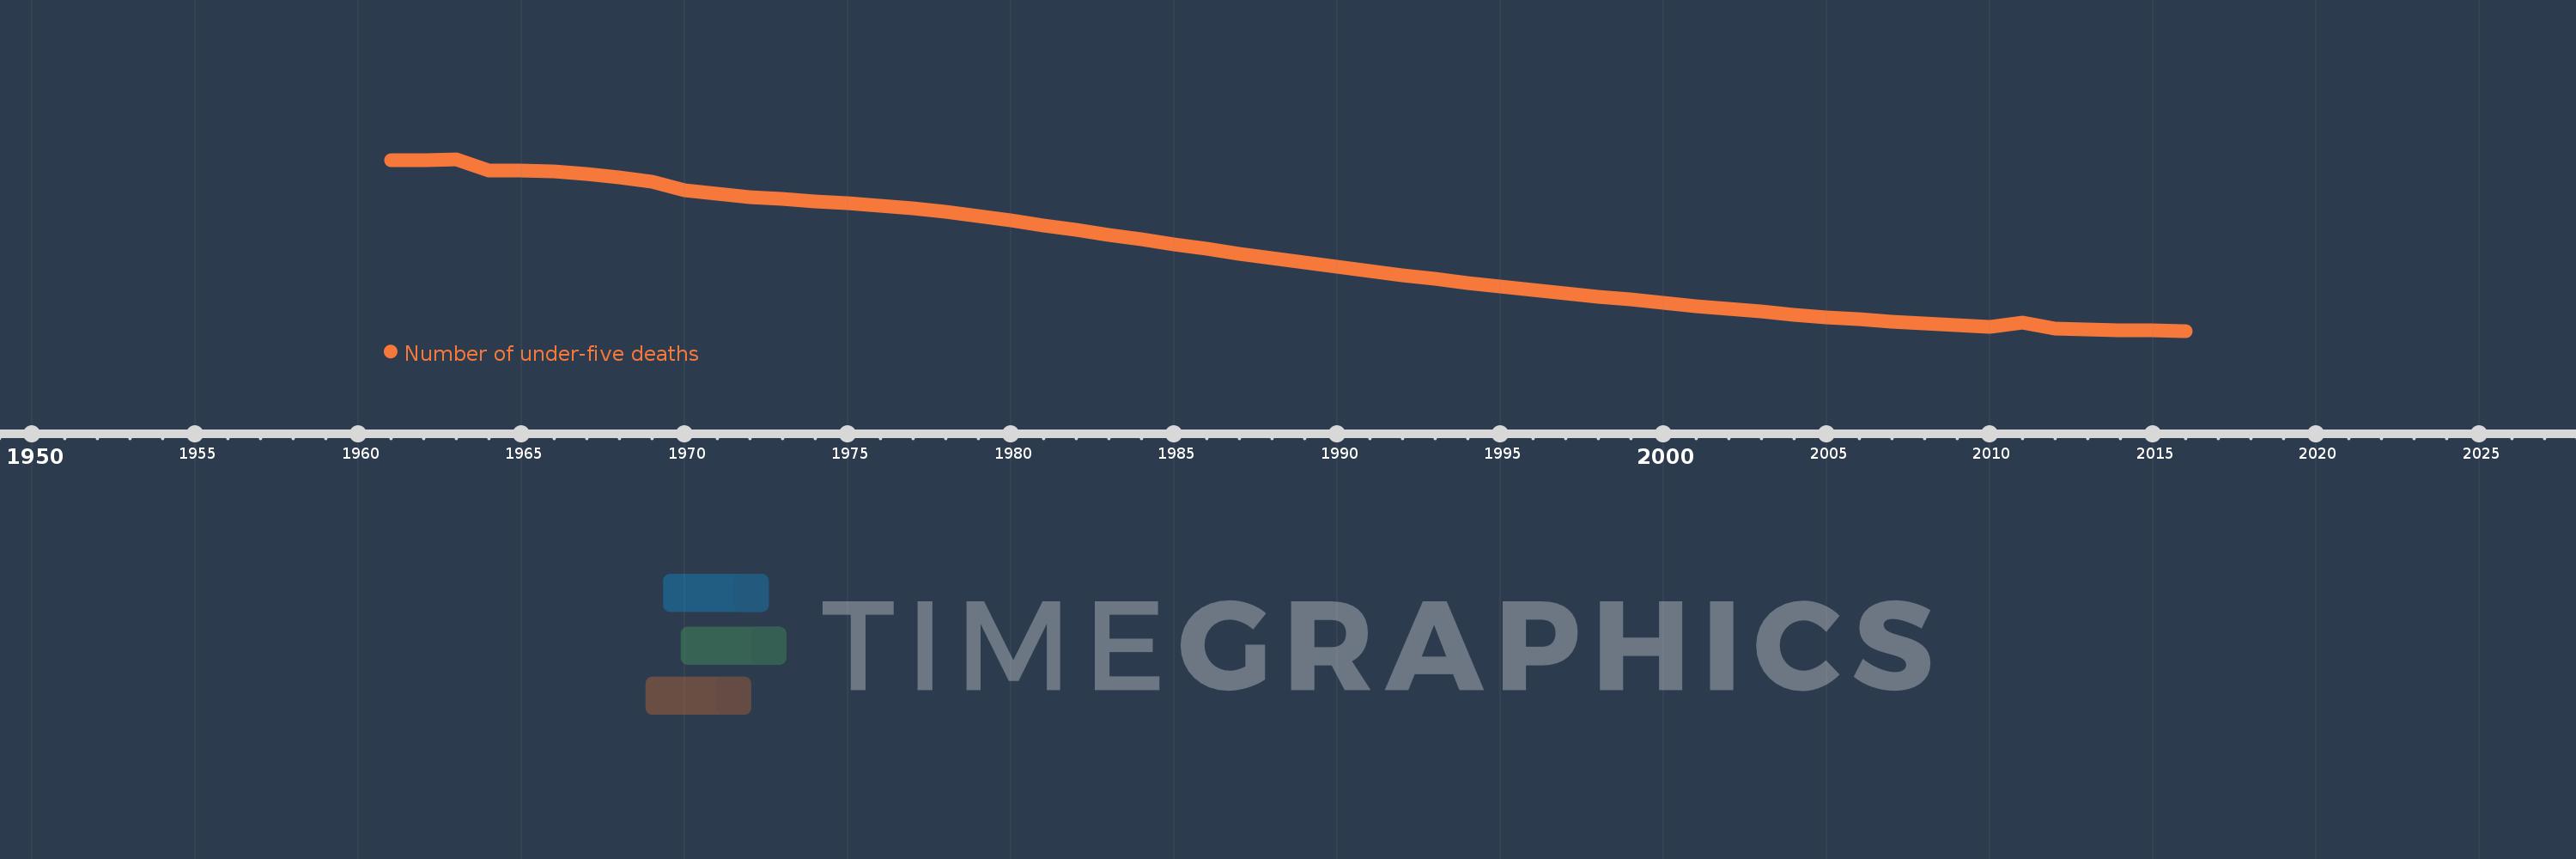
Number of under-five deaths
2016,2015,2014,2013,2012,2011,2010,2009,2008,2007,2006,2005,2004,2003,2002,2001,2000,1999,1998,1997,1996,1995,1994,1993,1992,1991,1990,1989,1988,1987,1986,1985,1984,1983,1982,1981,1980,1979,1978,1977,1976,1975,1974,1973,1972,1971,1970,1969,1968,1967,1966,1965,1964,1963,1962,1961
This statistics in other country:
AfghanistanAlbaniaAlgeriaAndorraAngolaAntigua and BarbudaArgentinaArmeniaAustraliaAustriaAzerbaijanBahamas, TheBahrainBangladeshBarbadosBelarusBelgiumBelizeBeninBhutanBoliviaBosnia and HerzegovinaBotswanaBrazilBrunei DarussalamBulgariaBurkina FasoBurundiCabo VerdeCambodiaCameroonCanadaCentral African RepublicChadChileChinaColombiaComorosCongo, Dem. Rep.Congo, Rep.Costa RicaCote d'IvoireCroatiaCubaCyprusCzech RepublicDenmarkDjiboutiDominicaDominican RepublicEast Asia & Pacific (excluding high income)EcuadorEgypt, Arab Rep.El SalvadorEquatorial GuineaEritreaEstoniaEthiopiaEurope & Central Asia (excluding high income)FijiFinlandFranceGabonGambia, TheGeorgiaGermanyGhanaGreeceGrenadaGuatemalaGuineaGuinea-BissauGuyanaHaitiHigh incomeHondurasHungaryIcelandIndiaIndonesiaIran, Islamic Rep.IraqIrelandIsraelItalyJamaicaJapanJordanKazakhstanKenyaKiribatiKorea, Dem. People’s Rep.Korea, Rep.KuwaitKyrgyz RepublicLao PDRLatin America & Caribbean (excluding high income)LatviaLebanonLesothoLiberiaLibyaLithuaniaLow & middle incomeLow incomeLower middle incomeLuxembourgMacedonia, FYRMadagascarMalawiMalaysiaMaldivesMaliMaltaMarshall IslandsMauritaniaMauritiusMexicoMicronesia, Fed. Sts.Middle East & North Africa (excluding high income)Middle incomeMoldovaMonacoMongoliaMontenegroMoroccoMozambiqueMyanmarNamibiaNauruNepalNetherlandsNew ZealandNicaraguaNigerNigeriaNorwayOmanPakistanPalauPanamaPapua New GuineaParaguayPeruPhilippinesPolandPortugalQatarRomaniaRussian FederationRwandaSamoaSan MarinoSao Tome and PrincipeSaudi ArabiaSenegalSerbiaSeychellesSierra LeoneSingaporeSlovak RepublicSloveniaSolomon IslandsSomaliaSouth AfricaSouth AsiaSouth SudanSpainSri LankaSt. Kitts and NevisSt. LuciaSt. Vincent and the GrenadinesSub-Saharan Africa (excluding high income)SudanSurinameSwazilandSwedenSwitzerlandSyrian Arab RepublicTajikistanTanzaniaThailandTimor-LesteTogoTongaTrinidad and TobagoTunisiaTurkeyTurkmenistanTuvaluUgandaUkraineUnited Arab EmiratesUnited KingdomUnited StatesUpper middle incomeUruguayUzbekistanVanuatuVenezuela, RBVietnamWest Bank and GazaWorldYemen, Rep.ZambiaZimbabwe Timeline:
This timeline shows a graph from 1961 to 2016 of Latin America & Caribbean (excluding high income). No data until 1960. Number of actual observations by date: 56.
Source name:
World Development Indicators
Source organization:
Estimates developed by the UN Inter-agency Group for Child Mortality Estimation (UNICEF, WHO, World Bank, UN DESA Population Division) at www.childmortality.org.
Categories, topics:
Health
Last updated:
apr 23, 2017
Indicators value changes by year
Minimum:
193.332K
jan 1, 2016
Maximum:
1.433 mln
jan 1, 1963
At the date of observation
Value
Absolute change
Change from previous value
jan 1, 1961
1.427 mln
+1.427 mln
0.0%
jan 1, 1962
1.426 mln
-1.481K
-0.1%
jan 1, 1963
1.433 mln
+7.504K
0.53%
jan 1, 1964
1.348 mln
-84.619K
-5.9%
jan 1, 1965
1.353 mln
+4.283K
0.32%
jan 1, 1966
1.343 mln
-10.023K
-0.74%
jan 1, 1967
1.328 mln
-15.121K
-1.13%
jan 1, 1968
1.302 mln
-25.728K
-1.94%
jan 1, 1969
1.269 mln
-32.517K
-2.5%
jan 1, 1970
1.206 mln
-63.051K
-4.97%
jan 1, 1971
1.181 mln
-25.412K
-2.11%
jan 1, 1972
1.16 mln
-20.897K
-1.77%
jan 1, 1973
1.143 mln
-16.932K
-1.46%
jan 1, 1974
1.13 mln
-13.448K
-1.18%
jan 1, 1975
1.116 mln
-14.066K
-1.25%
jan 1, 1976
1.098 mln
-17.083K
-1.53%
jan 1, 1977
1.078 mln
-20.391K
-1.86%
jan 1, 1978
1.053 mln
-25.54K
-2.37%
jan 1, 1979
1.023 mln
-29.349K
-2.79%
jan 1, 1980
989.762K
-33.398K
-3.26%
jan 1, 1981
955.499K
-34.263K
-3.46%
jan 1, 1982
920.708K
-34.791K
-3.64%
jan 1, 1983
886.128K
-34.58K
-3.76%
jan 1, 1984
851.881K
-34.247K
-3.86%
jan 1, 1985
818.202K
-33.679K
-3.95%
jan 1, 1986
784.673K
-33.529K
-4.1%
jan 1, 1987
751.336K
-33.337K
-4.25%
jan 1, 1988
717.488K
-33.848K
-4.51%
jan 1, 1989
684.719K
-32.769K
-4.57%
jan 1, 1990
653.535K
-31.184K
-4.55%
jan 1, 1991
623.838K
-29.697K
-4.54%
jan 1, 1992
595.089K
-28.749K
-4.61%
jan 1, 1993
566.985K
-28.104K
-4.72%
jan 1, 1994
539.89K
-27.095K
-4.78%
jan 1, 1995
513.506K
-26.384K
-4.89%
jan 1, 1996
488.08K
-25.426K
-4.95%
jan 1, 1997
464.001K
-24.079K
-4.93%
jan 1, 1998
440.883K
-23.118K
-4.98%
jan 1, 1999
422.559K
-18.324K
-4.16%
jan 1, 2000
398.76K
-23.799K
-5.63%
jan 1, 2001
373.791K
-24.969K
-6.26%
jan 1, 2002
352.449K
-21.342K
-5.71%
jan 1, 2003
331.489K
-20.96K
-5.95%
jan 1, 2004
311.902K
-19.587K
-5.91%
jan 1, 2005
293.665K
-18.237K
-5.85%
jan 1, 2006
276.382K
-17.283K
-5.89%
jan 1, 2007
260.967K
-15.415K
-5.58%
jan 1, 2008
247.237K
-13.73K
-5.26%
jan 1, 2009
234.807K
-12.43K
-5.03%
jan 1, 2010
224.369K
-10.438K
-4.45%
jan 1, 2011
254.525K
+30.156K
13.44%
jan 1, 2012
209.266K
-45.259K
-17.78%
jan 1, 2013
204.318K
-4.948K
-2.36%
jan 1, 2014
200.333K
-3.985K
-1.95%
jan 1, 2015
197.043K
-3.29K
-1.64%
jan 1, 2016
193.332K
-3.711K
-1.88%
Ranking of countries by current statistics by years


Comments: