30
/
AIzaSyAYiBZKx7MnpbEhh9jyipgxe19OcubqV5w
April 1, 2024
194586
Mauritius
MUS
true
2
1
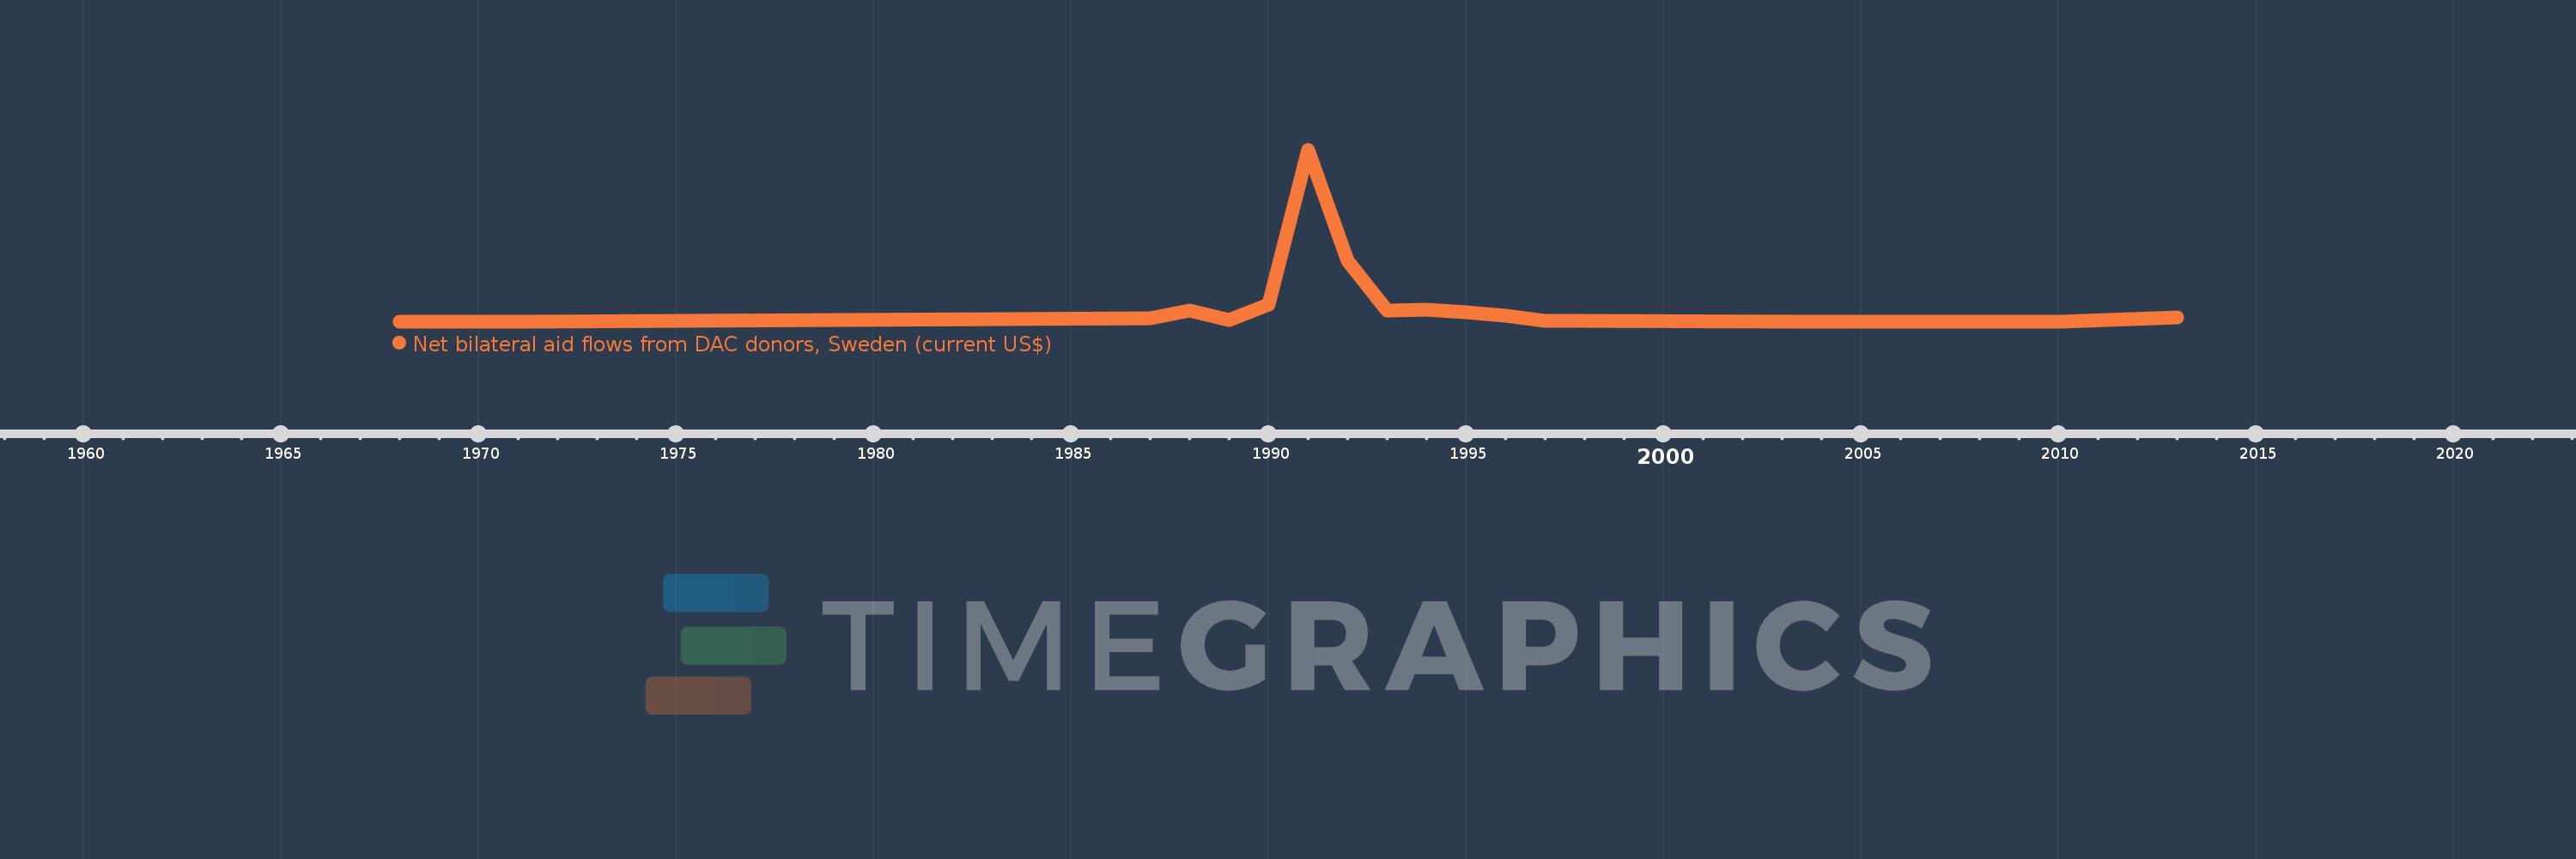
Net bilateral aid flows from DAC donors, Sweden (current US$)
2013,2010,2009,2007,2006,2005,2004,1998,1997,1996,1995,1994,1993,1992,1991,1990,1989,1988,1987,1971,1970,1969,1968
