29
/
en
AIzaSyAYiBZKx7MnpbEhh9jyipgxe19OcubqV5w
April 1, 2024
210727
Nicaragua
NIC
true
2
1
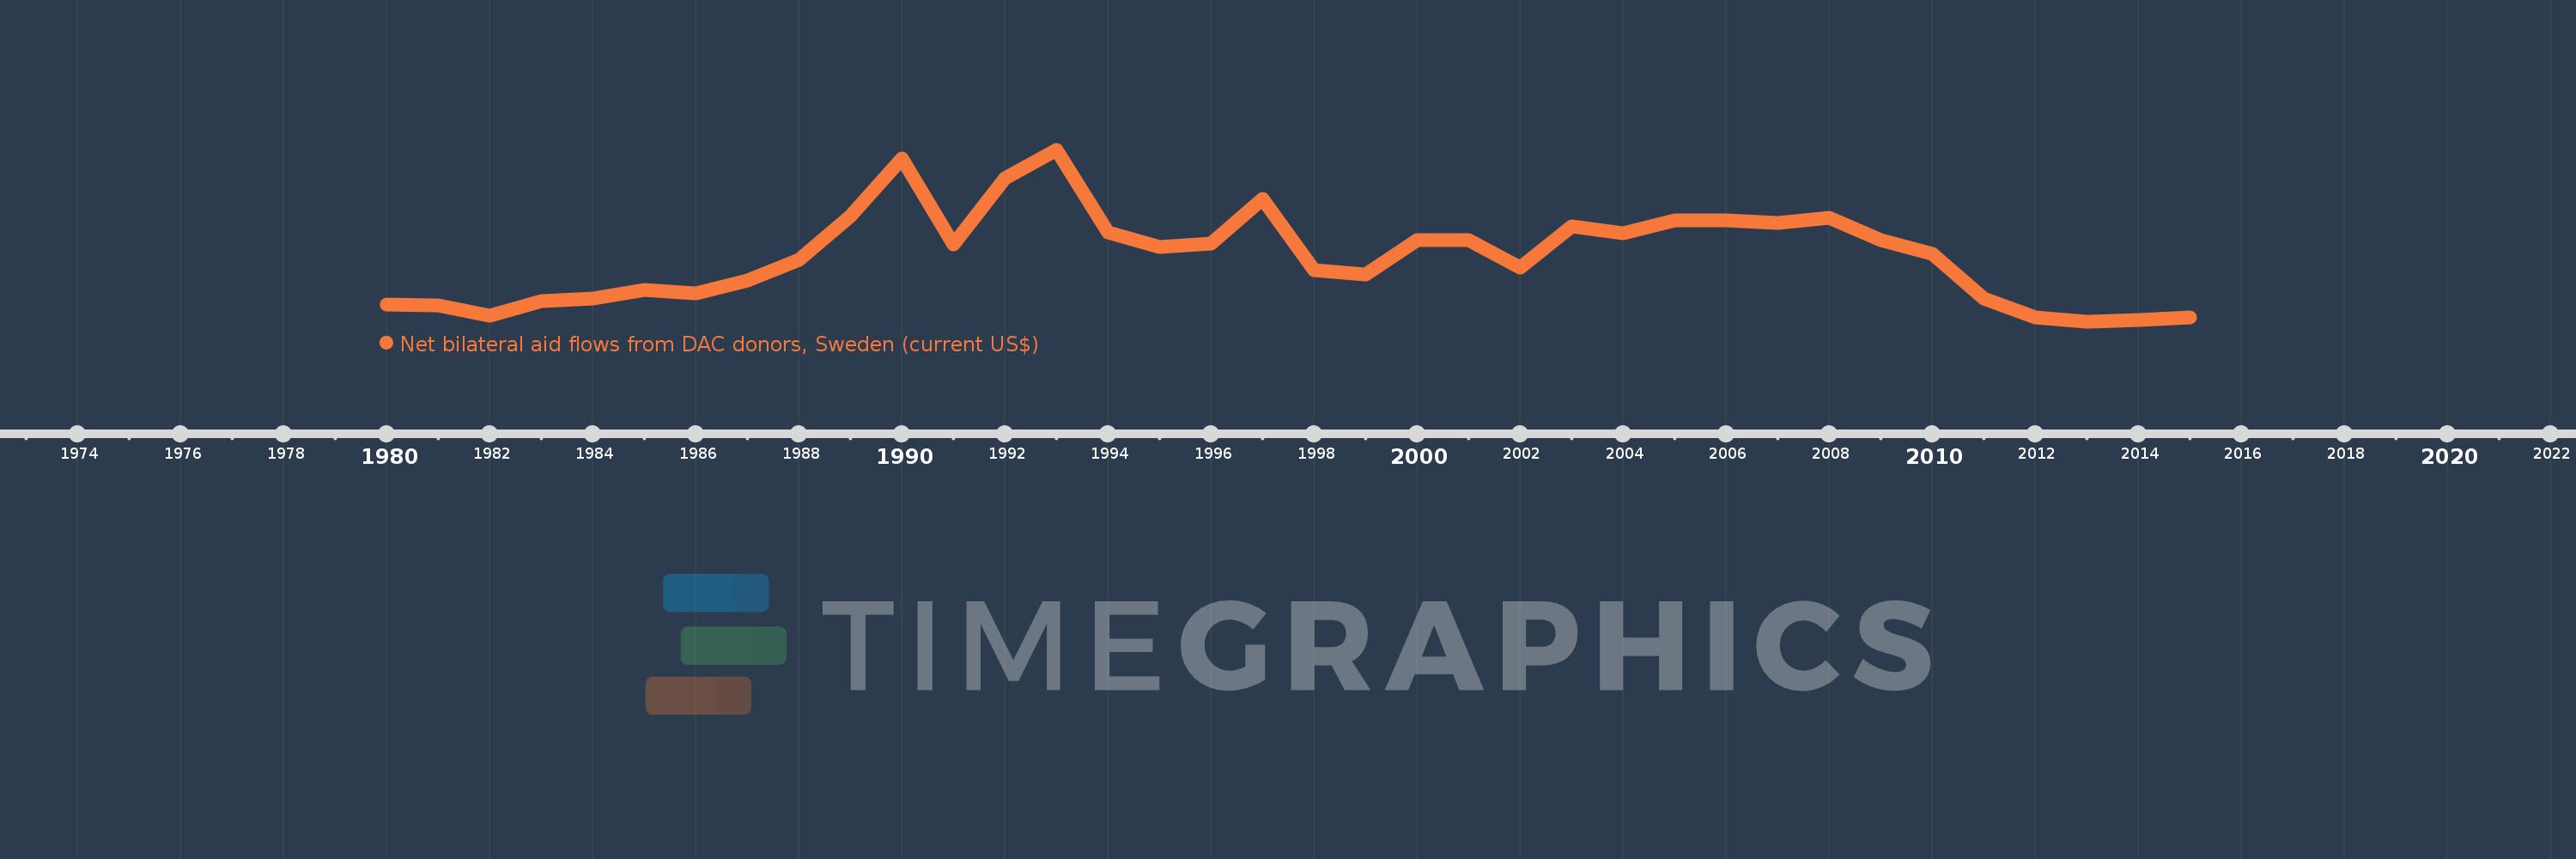
Net bilateral aid flows from DAC donors, Sweden (current US$)
2015,2014,2013,2012,2011,2010,2009,2008,2007,2006,2005,2004,2003,2002,2001,2000,1999,1998,1997,1996,1995,1994,1993,1992,1991,1990,1989,1988,1987,1986,1985,1984,1983,1982,1981,1980
This statistics in other country:
AfghanistanAlbaniaAlgeriaAngolaAntigua and BarbudaArab WorldArgentinaArmeniaAzerbaijanBangladeshBelarusBelizeBeninBhutanBoliviaBosnia and HerzegovinaBotswanaBrazilBrunei DarussalamBulgariaBurkina FasoBurundiCabo VerdeCambodiaCameroonCaribbean small statesCentral African RepublicCentral Europe and the BalticsChadChileChinaColombiaComorosCongo, Dem. Rep.Congo, Rep.Costa RicaCote d'IvoireCroatiaCubaCyprusCzech RepublicDjiboutiDominicaDominican RepublicEast Asia & PacificEast Asia & Pacific (excluding high income)East Asia & Pacific (IDA & IBRD countries)EcuadorEgypt, Arab Rep.El SalvadorEquatorial GuineaEritreaEstoniaEthiopiaEuro areaEurope & Central AsiaEurope & Central Asia (excluding high income)Europe & Central Asia (IDA & IBRD countries)European UnionFijiFragile and conflict affected situationsGabonGambia, TheGeorgiaGhanaGrenadaGuatemalaGuineaGuinea-BissauGuyanaHaitiHeavily indebted poor countries (HIPC)High incomeHondurasHong Kong SAR, ChinaHungaryIBRD onlyIDA & IBRD totalIDA blendIDA onlyIDA totalIndiaIndonesiaIran, Islamic Rep.IraqIsraelJamaicaJordanKazakhstanKenyaKorea, Dem. People’s Rep.Korea, Rep.KosovoKuwaitKyrgyz RepublicLao PDRLatin America & Caribbean Latin America & Caribbean (excluding high income)Latin America & the Caribbean (IDA & IBRD countries)LatviaLeast developed countries: UN classificationLebanonLesothoLiberiaLibyaLithuaniaLow & middle incomeLow incomeLower middle incomeMacao SAR, ChinaMacedonia, FYRMadagascarMalawiMalaysiaMaldivesMaliMarshall IslandsMauritaniaMauritiusMexicoMicronesia, Fed. Sts.Middle East & North AfricaMiddle East & North Africa (excluding high income)Middle East & North Africa (IDA & IBRD countries)Middle incomeMoldovaMongoliaMontenegroMoroccoMozambiqueMyanmarNamibiaNepalNicaraguaNigerNigeriaOECD membersOther small statesPacific island small statesPakistanPanamaPapua New GuineaParaguayPeruPhilippinesPolandRomaniaRussian FederationRwandaSamoaSao Tome and PrincipeSaudi ArabiaSenegalSerbiaSeychellesSierra LeoneSingaporeSlovak RepublicSloveniaSmall statesSolomon IslandsSomaliaSouth AfricaSouth AsiaSouth Asia (IDA & IBRD)South SudanSri LankaSt. Kitts and NevisSt. LuciaSt. Vincent and the GrenadinesSub-Saharan Africa Sub-Saharan Africa (excluding high income)Sub-Saharan Africa (IDA & IBRD countries)SudanSurinameSwazilandSyrian Arab RepublicTajikistanTanzaniaThailandTimor-LesteTogoTrinidad and TobagoTunisiaTurkeyTurkmenistanUgandaUkraineUpper middle incomeUruguayUzbekistanVanuatuVenezuela, RBVietnamWest Bank and GazaWorldYemen, Rep.ZambiaZimbabwe Timeline:
This timeline shows a graph from 1980 to 2015 of Nicaragua. No data until 1979. Number of actual observations by date: 36.
Source name:
World Development Indicators
Source organization:
Development Assistance Committee of the Organisation for Economic Co-operation and Development, Geographical Distribution of Financial Flows to Developing Countries, Development Co-operation Report, and International Development Statistics database. Data are available online at: www.oecd.org/dac/stats/idsonline.
Categories, topics:
Aid Effectiveness
Last updated:
apr 23, 2017
Indicators value changes by year
Minimum:
1.27 mln
jan 1, 2013
Maximum:
68.52 mln
jan 1, 1993
At the date of observation
Value
Absolute change
Change from previous value
jan 1, 1980
8.12 mln
+8.12 mln
0.0%
jan 1, 1981
7.66 mln
-460.0K
-5.67%
jan 1, 1982
3.87 mln
-3.79 mln
-49.48%
jan 1, 1983
9.32 mln
+5.45 mln
140.83%
jan 1, 1984
10.58 mln
+1.26 mln
13.52%
jan 1, 1985
13.68 mln
+3.1 mln
29.3%
jan 1, 1986
12.61 mln
-1.07 mln
-7.82%
jan 1, 1987
17.54 mln
+4.93 mln
39.1%
jan 1, 1988
25.59 mln
+8.05 mln
45.9%
jan 1, 1989
42.72 mln
+17.13 mln
66.94%
jan 1, 1990
65.15 mln
+22.43 mln
52.5%
jan 1, 1991
31.56 mln
-33.59 mln
-51.56%
jan 1, 1992
57.46 mln
+25.9 mln
82.07%
jan 1, 1993
68.52 mln
+11.06 mln
19.25%
jan 1, 1994
36.26 mln
-32.26 mln
-47.08%
jan 1, 1995
30.66 mln
-5.6 mln
-15.44%
jan 1, 1996
31.82 mln
+1.16 mln
3.78%
jan 1, 1997
49.43 mln
+17.61 mln
55.34%
jan 1, 1998
21.48 mln
-27.95 mln
-56.54%
jan 1, 1999
19.83 mln
-1.65 mln
-7.68%
jan 1, 2000
33.29 mln
+13.46 mln
67.88%
jan 1, 2001
33.32 mln
+30.0K
0.09%
jan 1, 2002
22.72 mln
-10.6 mln
-31.81%
jan 1, 2003
38.65 mln
+15.93 mln
70.11%
jan 1, 2004
35.92 mln
-2.73 mln
-7.06%
jan 1, 2005
41.1 mln
+5.18 mln
14.42%
jan 1, 2006
40.91 mln
-190.0K
-0.46%
jan 1, 2007
40.16 mln
-750.0K
-1.83%
jan 1, 2008
41.93 mln
+1.77 mln
4.41%
jan 1, 2009
33.46 mln
-8.47 mln
-20.2%
jan 1, 2010
27.95 mln
-5.51 mln
-16.47%
jan 1, 2011
10.54 mln
-17.41 mln
-62.29%
jan 1, 2012
3.06 mln
-7.48 mln
-70.97%
jan 1, 2013
1.27 mln
-1.79 mln
-58.5%
jan 1, 2014
1.99 mln
+720.0K
56.69%
jan 1, 2015
3.02 mln
+1.03 mln
51.76%
Ranking of countries by current statistics by years


Comments: