29
/
en
AIzaSyAYiBZKx7MnpbEhh9jyipgxe19OcubqV5w
April 1, 2024
146001
Guinea
GIN
true
2
1
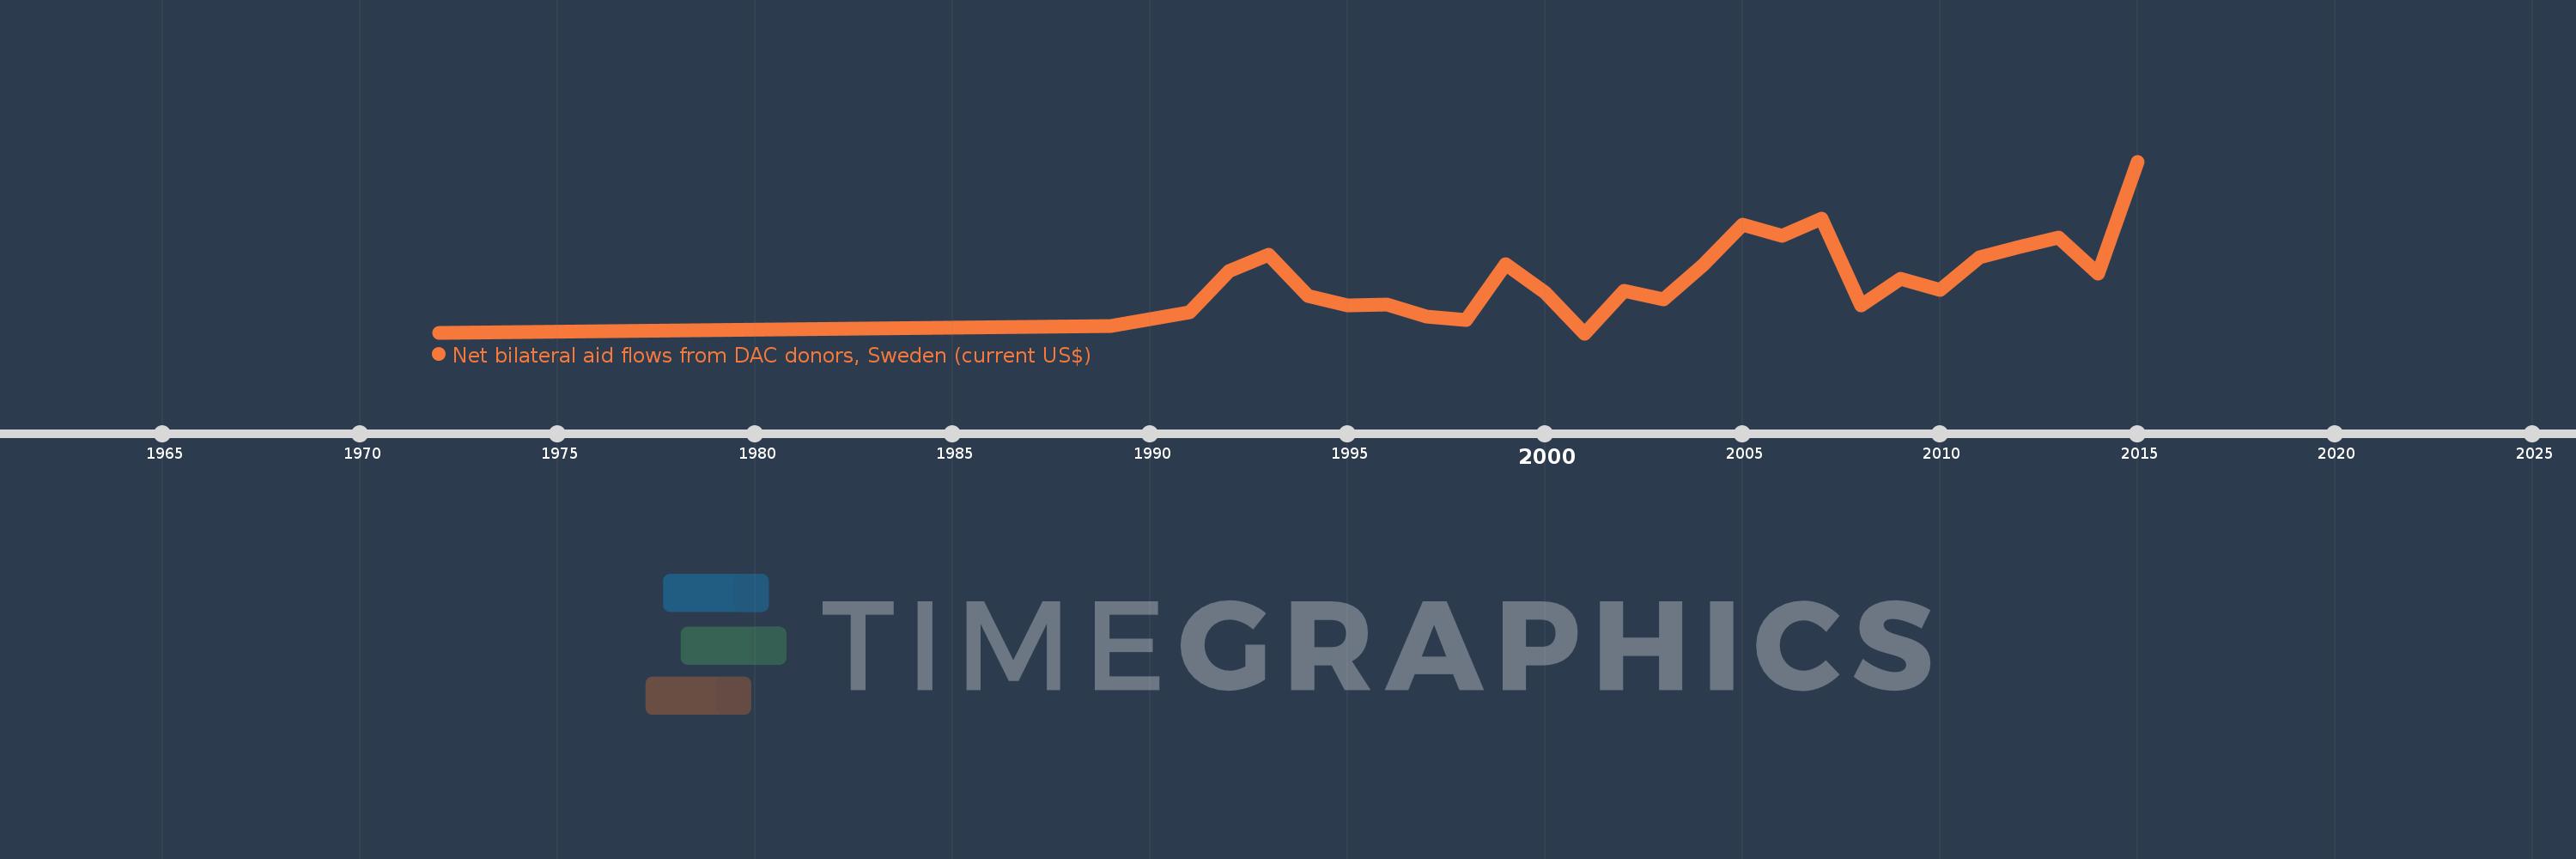
Net bilateral aid flows from DAC donors, Sweden (current US$)
2015,2014,2013,2012,2011,2010,2009,2008,2007,2006,2005,2004,2003,2002,2001,2000,1999,1998,1997,1996,1995,1994,1993,1992,1991,1989,1972
This statistics in other country:
AfghanistanAlbaniaAlgeriaAngolaAntigua and BarbudaArab WorldArgentinaArmeniaAzerbaijanBangladeshBelarusBelizeBeninBhutanBoliviaBosnia and HerzegovinaBotswanaBrazilBrunei DarussalamBulgariaBurkina FasoBurundiCabo VerdeCambodiaCameroonCaribbean small statesCentral African RepublicCentral Europe and the BalticsChadChileChinaColombiaComorosCongo, Dem. Rep.Congo, Rep.Costa RicaCote d'IvoireCroatiaCubaCyprusCzech RepublicDjiboutiDominicaDominican RepublicEast Asia & PacificEast Asia & Pacific (excluding high income)East Asia & Pacific (IDA & IBRD countries)EcuadorEgypt, Arab Rep.El SalvadorEquatorial GuineaEritreaEstoniaEthiopiaEuro areaEurope & Central AsiaEurope & Central Asia (excluding high income)Europe & Central Asia (IDA & IBRD countries)European UnionFijiFragile and conflict affected situationsGabonGambia, TheGeorgiaGhanaGrenadaGuatemalaGuineaGuinea-BissauGuyanaHaitiHeavily indebted poor countries (HIPC)High incomeHondurasHong Kong SAR, ChinaHungaryIBRD onlyIDA & IBRD totalIDA blendIDA onlyIDA totalIndiaIndonesiaIran, Islamic Rep.IraqIsraelJamaicaJordanKazakhstanKenyaKorea, Dem. People’s Rep.Korea, Rep.KosovoKuwaitKyrgyz RepublicLao PDRLatin America & Caribbean Latin America & Caribbean (excluding high income)Latin America & the Caribbean (IDA & IBRD countries)LatviaLeast developed countries: UN classificationLebanonLesothoLiberiaLibyaLithuaniaLow & middle incomeLow incomeLower middle incomeMacao SAR, ChinaMacedonia, FYRMadagascarMalawiMalaysiaMaldivesMaliMarshall IslandsMauritaniaMauritiusMexicoMicronesia, Fed. Sts.Middle East & North AfricaMiddle East & North Africa (excluding high income)Middle East & North Africa (IDA & IBRD countries)Middle incomeMoldovaMongoliaMontenegroMoroccoMozambiqueMyanmarNamibiaNepalNicaraguaNigerNigeriaOECD membersOther small statesPacific island small statesPakistanPanamaPapua New GuineaParaguayPeruPhilippinesPolandRomaniaRussian FederationRwandaSamoaSao Tome and PrincipeSaudi ArabiaSenegalSerbiaSeychellesSierra LeoneSingaporeSlovak RepublicSloveniaSmall statesSolomon IslandsSomaliaSouth AfricaSouth AsiaSouth Asia (IDA & IBRD)South SudanSri LankaSt. Kitts and NevisSt. LuciaSt. Vincent and the GrenadinesSub-Saharan Africa Sub-Saharan Africa (excluding high income)Sub-Saharan Africa (IDA & IBRD countries)SudanSurinameSwazilandSyrian Arab RepublicTajikistanTanzaniaThailandTimor-LesteTogoTrinidad and TobagoTunisiaTurkeyTurkmenistanUgandaUkraineUpper middle incomeUruguayUzbekistanVanuatuVenezuela, RBVietnamWest Bank and GazaWorldYemen, Rep.ZambiaZimbabwe Timeline:
This timeline shows a graph from 1972 to 2015 of Guinea. No data until 1971. Number of actual observations by date: 27.
Source name:
World Development Indicators
Source organization:
Development Assistance Committee of the Organisation for Economic Co-operation and Development, Geographical Distribution of Financial Flows to Developing Countries, Development Co-operation Report, and International Development Statistics database. Data are available online at: www.oecd.org/dac/stats/idsonline.
Categories, topics:
Aid Effectiveness
Last updated:
apr 23, 2017
Indicators value changes by year
Maximum:
2.17 mln
jan 1, 2015
At the date of observation
Value
Absolute change
Change from previous value
jan 1, 1972
80.0K
+80.0K
0.0%
jan 1, 1989
160.0K
+80.0K
100.0%
jan 1, 1991
330.0K
+170.0K
106.25%
jan 1, 1992
830.0K
+500.0K
151.52%
jan 1, 1993
1.03 mln
+200.0K
24.1%
jan 1, 1994
530.0K
-500.0K
-48.54%
jan 1, 1995
410.0K
-120.0K
-22.64%
jan 1, 1996
420.0K
+10.0K
2.44%
jan 1, 1997
270.0K
-150.0K
-35.71%
jan 1, 1998
230.0K
-40.0K
-14.81%
jan 1, 1999
920.0K
+690.0K
300.0%
jan 1, 2000
570.0K
-350.0K
-38.04%
jan 1, 2001
70.0K
-500.0K
-87.72%
jan 1, 2002
590.0K
+520.0K
742.86%
jan 1, 2003
490.0K
-100.0K
-16.95%
jan 1, 2004
900.0K
+410.0K
83.67%
jan 1, 2005
1.4 mln
+500.0K
55.56%
jan 1, 2006
1.26 mln
-140.0K
-10.0%
jan 1, 2007
1.47 mln
+210.0K
16.67%
jan 1, 2008
410.0K
-1.06 mln
-72.11%
jan 1, 2009
740.0K
+330.0K
80.49%
jan 1, 2010
600.0K
-140.0K
-18.92%
jan 1, 2011
1000.0K
+400.0K
66.67%
jan 1, 2012
1.13 mln
+130.0K
13.0%
jan 1, 2013
1.24 mln
+110.0K
9.73%
jan 1, 2014
800.0K
-440.0K
-35.48%
jan 1, 2015
2.17 mln
+1.37 mln
171.25%
Ranking of countries by current statistics by years


Comments: