Download This statistics in other country:
Timeline:
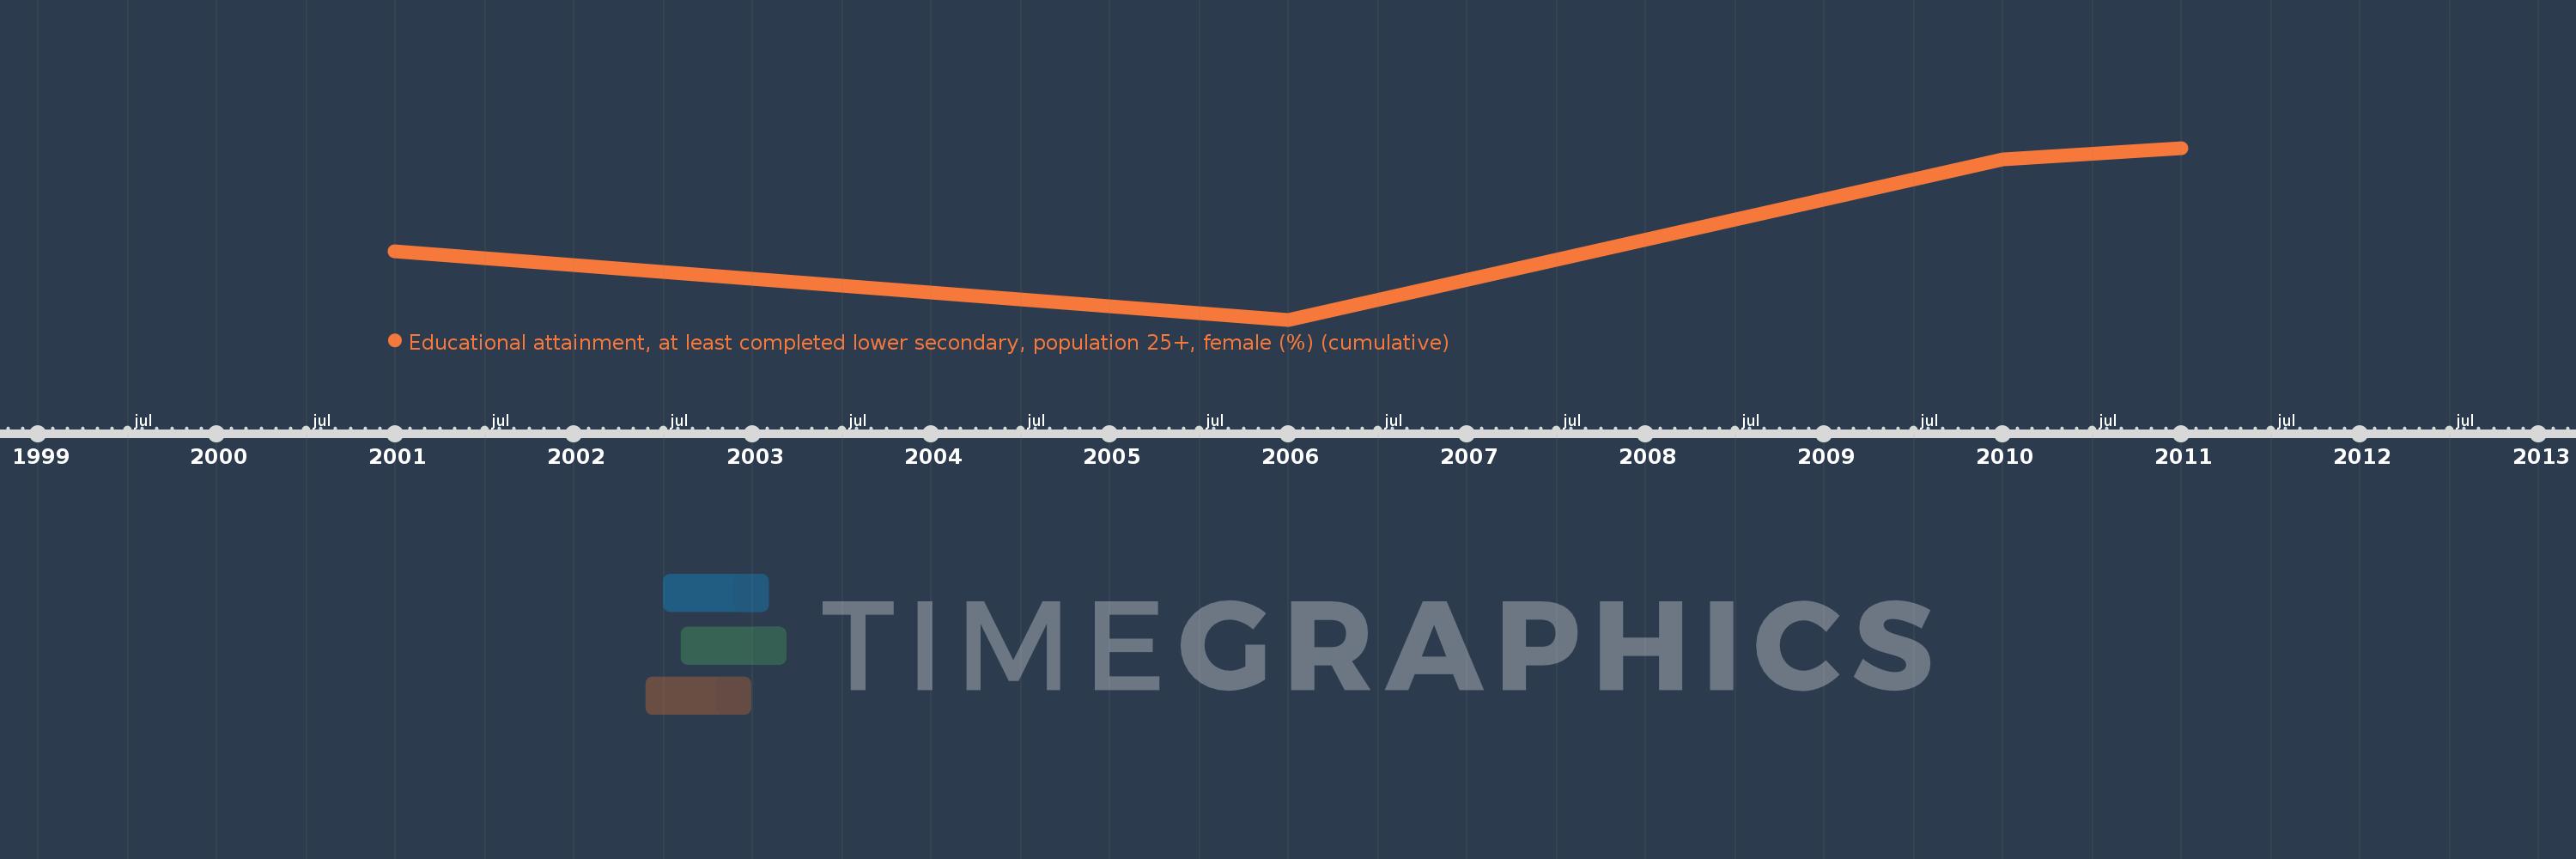
This timeline shows a graph from 2001 to 2011 of Malaysia. No data until 2000. Number of actual observations by date: 4.
Source name:
World Development Indicators
Source organization:
United Nations Educational, Scientific, and Cultural Organization (UNESCO) Institute for Statistics.
Categories, topics:
Education, Gender
Last updated:
apr 23, 2017
Indicators value changes by year
Minimum:
42.907
jan 1, 2006
Maximum:
65.076
jan 1, 2011
At the date of observation
Value
Absolute change
Change from the previous value
jan 1, 2001
51.696
+51.696
0.0%
jan 1, 2006
42.907
-8.789
-17.0%
jan 1, 2010
63.569
+20.662
48.15%
jan 1, 2011
65.076
+1.507
2.37%
Ranking of countries by current statistics by years
