29
/
en
AIzaSyAYiBZKx7MnpbEhh9jyipgxe19OcubqV5w
April 1, 2024
245439
South Africa
ZAF
true
2
1
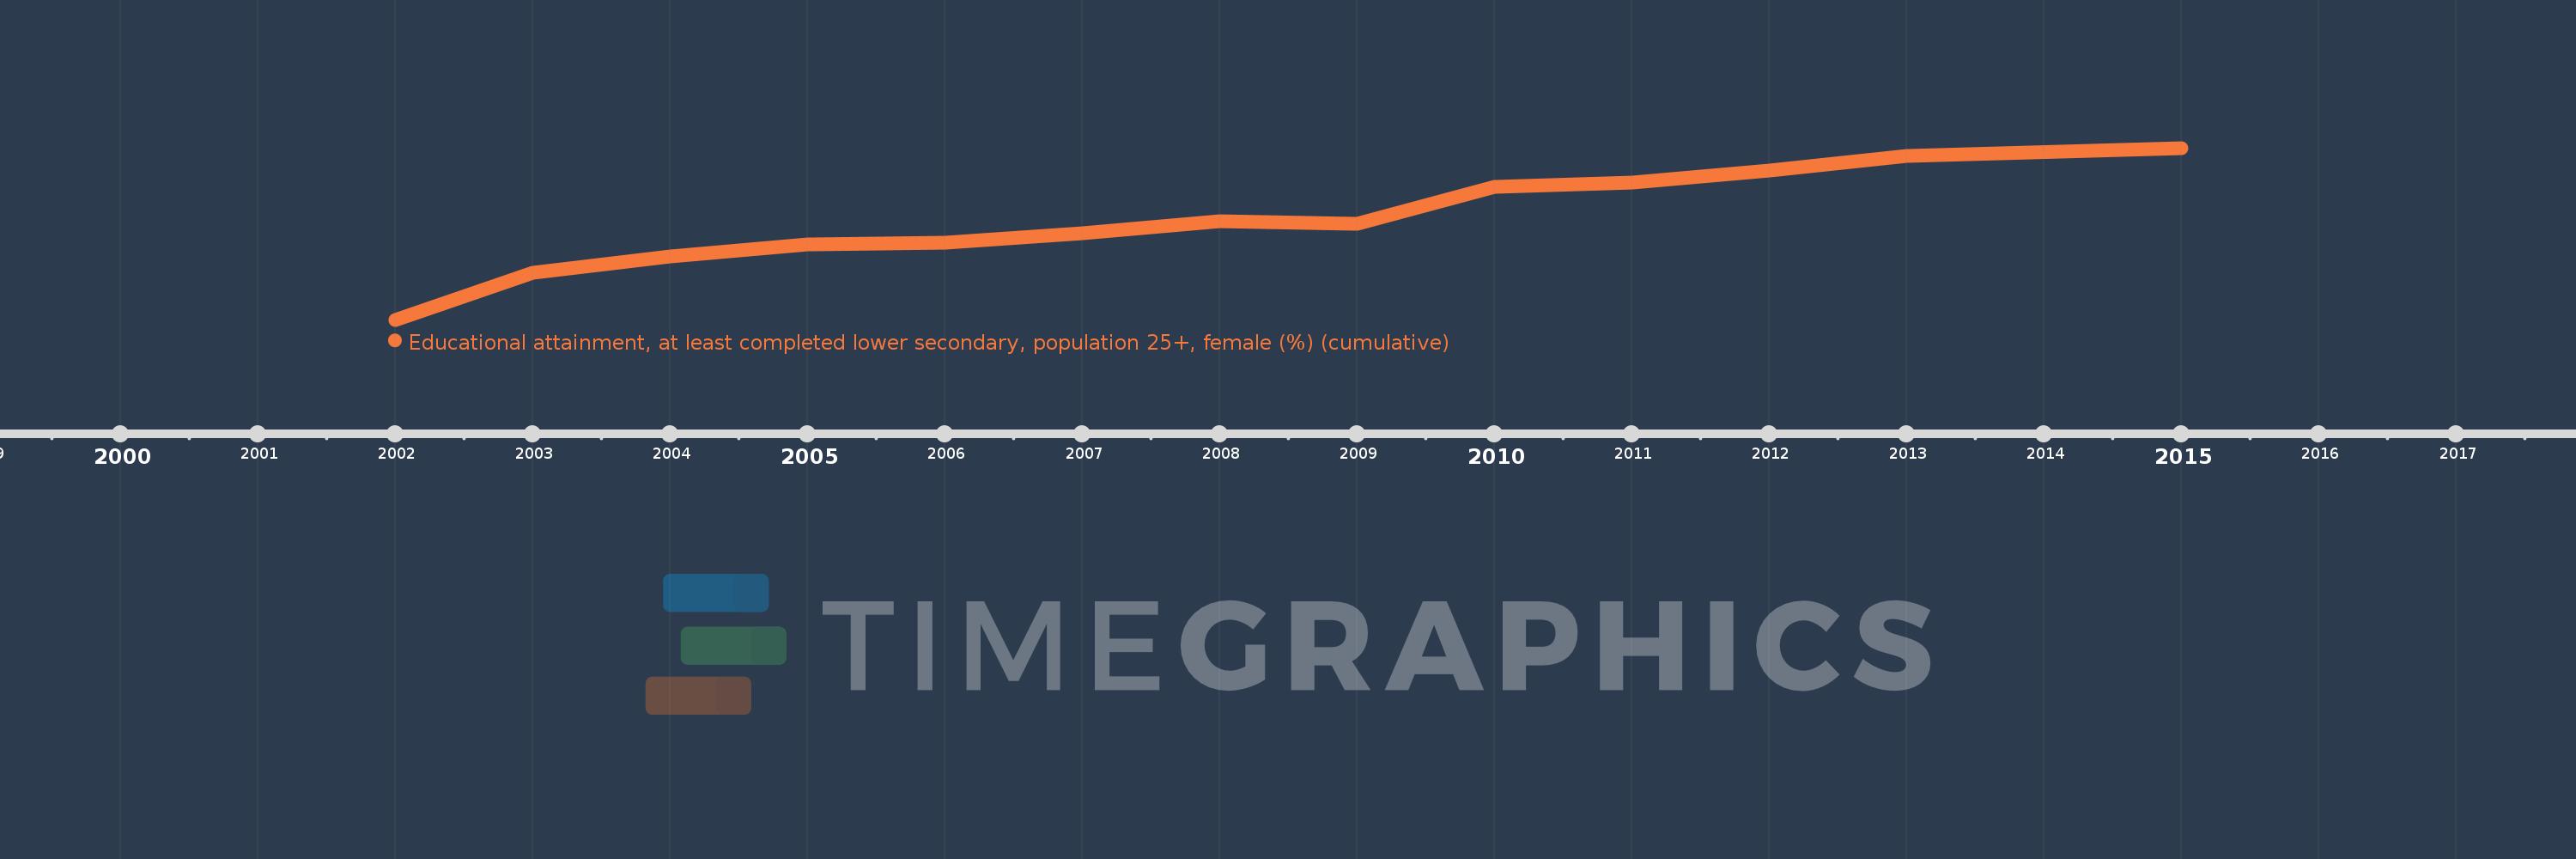
Educational attainment, at least completed lower secondary, population 25+, female (%) (cumulative)
2015,2013,2012,2011,2010,2009,2008,2007,2006,2005,2004,2003,2002
This statistics in other country:
Timeline:
This timeline shows a graph from 2002 to 2015 of South Africa. No data until 2001. Number of actual observations by date: 13.
Source name:
World Development Indicators
Source organization:
United Nations Educational, Scientific, and Cultural Organization (UNESCO) Institute for Statistics.
Categories, topics:
Education, Gender
Last updated:
apr 23, 2017
Indicators value changes by year
Minimum:
53.606
jan 1, 2002
Maximum:
73.701
jan 1, 2015
At the date of observation
Value
Absolute change
Change from previous value
jan 1, 2002
53.606
+53.606
0.0%
jan 1, 2003
59.125
+5.519
10.3%
jan 1, 2004
61.059
+1.934
3.27%
jan 1, 2005
62.459
+1.4
2.29%
jan 1, 2006
62.583
+0.124
0.2%
jan 1, 2007
63.725
+1.142
1.83%
jan 1, 2008
65.1
+1.375
2.16%
jan 1, 2009
64.789
-0.311
-0.48%
jan 1, 2010
69.131
+4.341
6.7%
jan 1, 2011
69.694
+0.564
0.82%
jan 1, 2012
71.066
+1.372
1.97%
jan 1, 2013
72.748
+1.682
2.37%
jan 1, 2015
73.701
+0.953
1.31%
Ranking of countries by current statistics by years


Comments: