29
/
en
AIzaSyAYiBZKx7MnpbEhh9jyipgxe19OcubqV5w
April 1, 2024
277532
Uruguay
URY
true
2
1
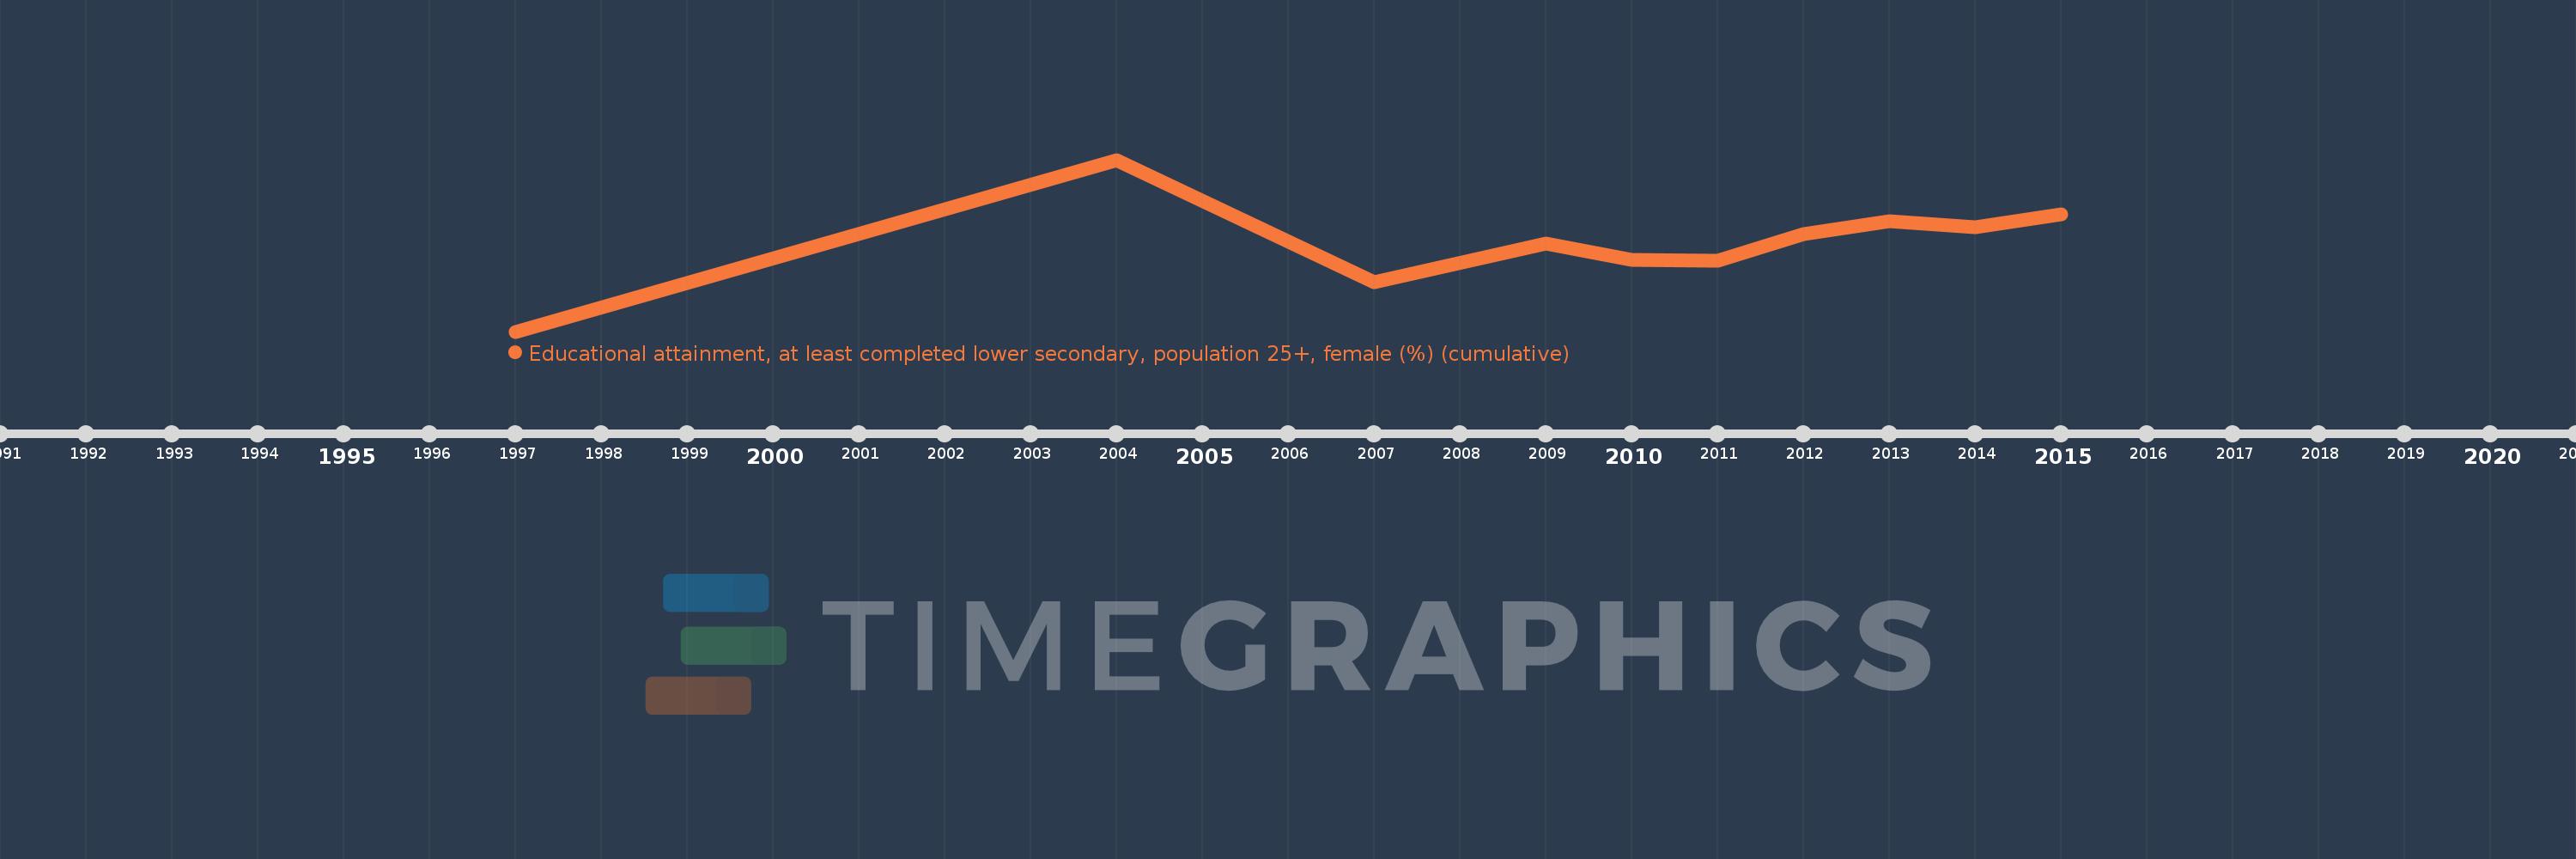
Educational attainment, at least completed lower secondary, population 25+, female (%) (cumulative)
2015,2014,2013,2012,2011,2010,2009,2007,2004,1997
This statistics in other country:
Timeline:
This timeline shows a graph from 1997 to 2015 of Uruguay. No data until 1996. Number of actual observations by date: 10.
Source name:
World Development Indicators
Source organization:
United Nations Educational, Scientific, and Cultural Organization (UNESCO) Institute for Statistics.
Categories, topics:
Education, Gender
Last updated:
apr 23, 2017
Indicators value changes by year
Minimum:
43.769
jan 1, 1997
Maximum:
60.236
jan 1, 2004
At the date of observation
Value
Absolute change
Change from previous value
jan 1, 1997
43.769
+43.769
0.0%
jan 1, 2004
60.236
+16.467
37.62%
jan 1, 2007
48.496
-11.74
-19.49%
jan 1, 2009
52.196
+3.701
7.63%
jan 1, 2010
50.633
-1.563
-3.0%
jan 1, 2011
50.601
-0.032
-0.06%
jan 1, 2012
53.115
+2.514
4.97%
jan 1, 2013
54.376
+1.262
2.38%
jan 1, 2014
53.8
-0.577
-1.06%
jan 1, 2015
54.967
+1.167
2.17%
Ranking of countries by current statistics by years


Comments: