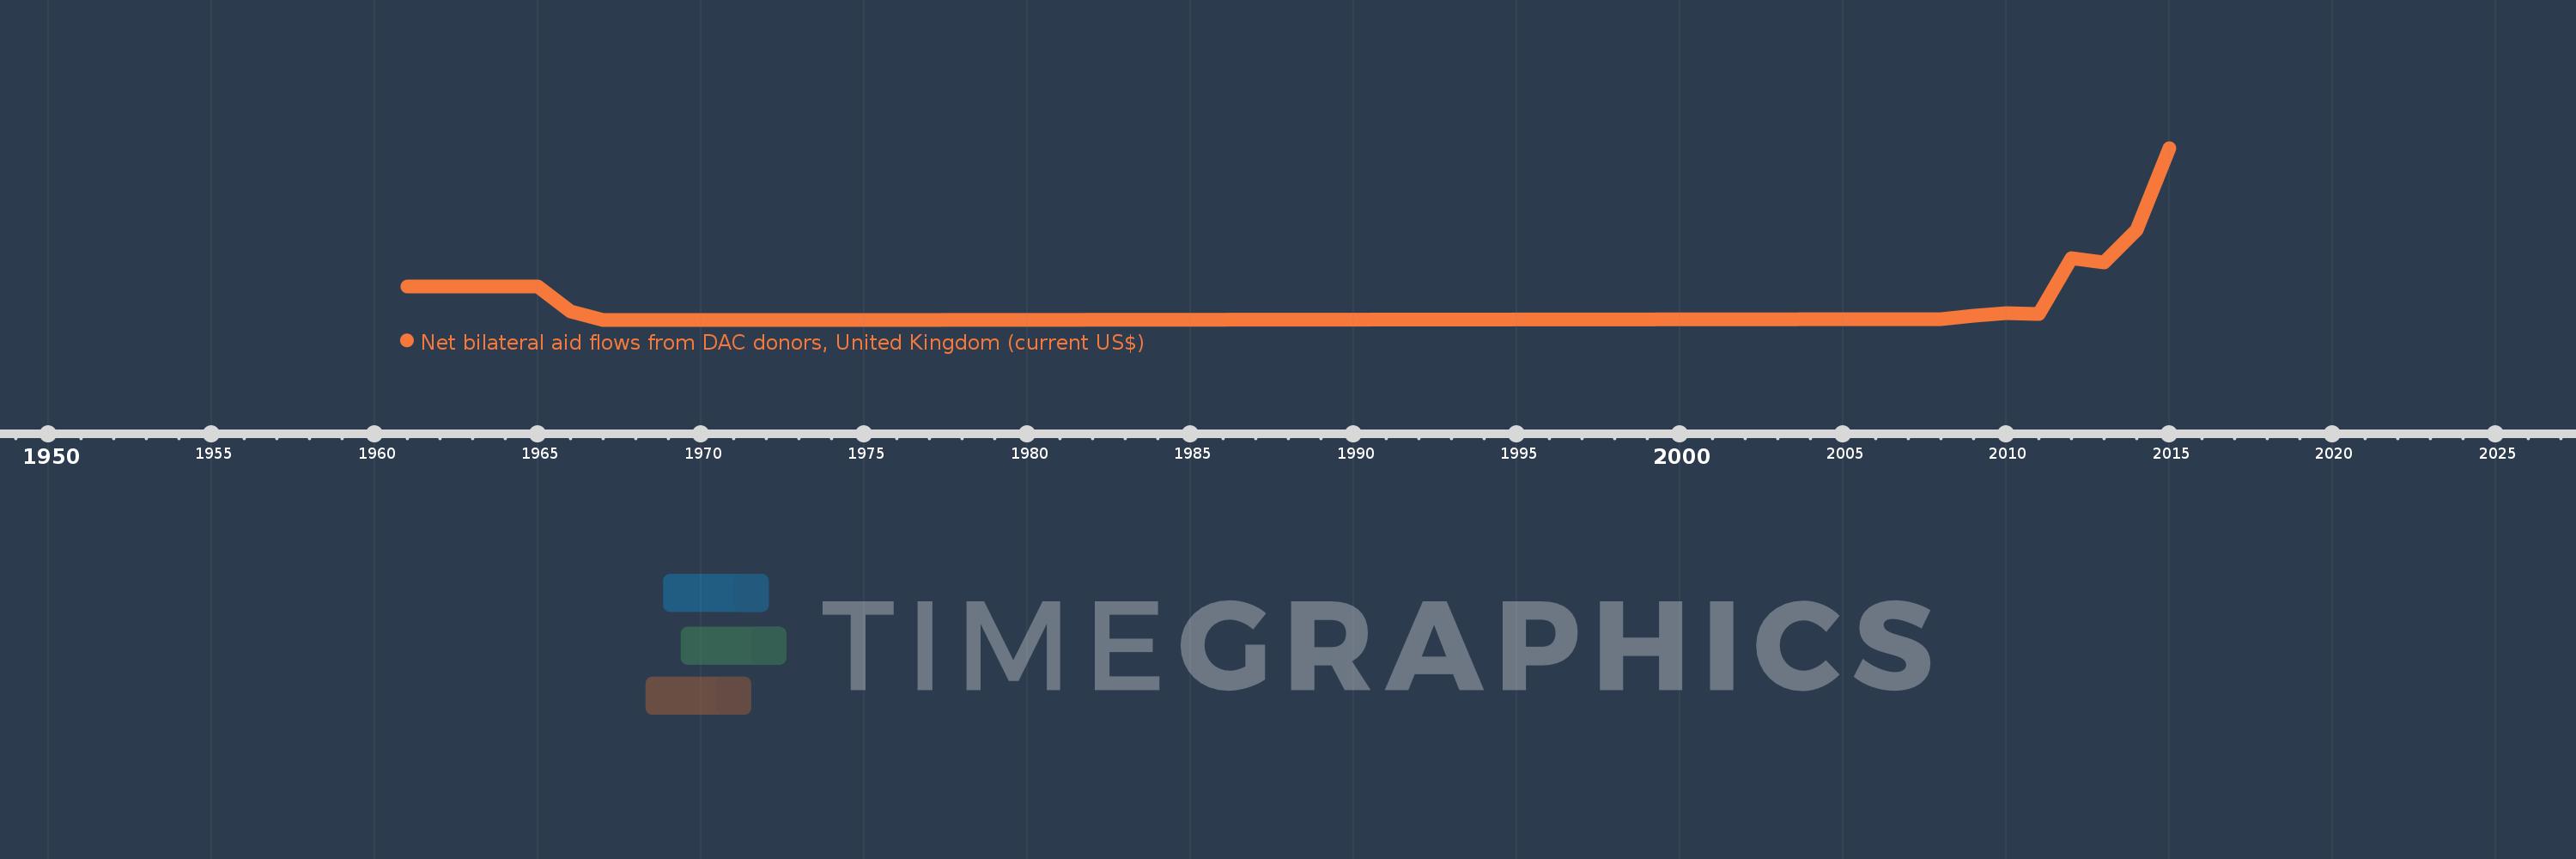
This timeline shows a graph from 1961 to 2015 of Libya. No data until 1960. Number of actual observations by date: 21.
Source name:
World Development Indicators
Source organization:
Development Assistance Committee of the Organisation for Economic Co-operation and Development, Geographical Distribution of Financial Flows to Developing Countries, Development Co-operation Report, and International Development Statistics database. Data are available online at: www.oecd.org/dac/stats/idsonline.
Categories, topics:
Aid Effectiveness
Last updated:
apr 23, 2017
Indicators value changes by year
Meaning:
7.494 mln
Minimum:
10.0K
jan 1, 1967
Maximum:
47.19 mln
jan 1, 2015
At the date of observation
Value
Absolute change
Change from the previous value
jan 1, 1961
9.1 mln
+9.1 mln
0.0%
jan 1, 1962
9.1 mln
0.0
0.0%
jan 1, 1963
9.1 mln
0.0
0.0%
jan 1, 1964
9.25 mln
+150.0K
1.65%
jan 1, 1965
9.11 mln
-140.0K
-1.51%
jan 1, 1966
2.28 mln
-6.83 mln
-74.97%
jan 1, 1967
10.0K
-2.27 mln
-99.56%
jan 1, 1968
20.0K
+10.0K
100.0%
jan 1, 1969
20.0K
0.0
0.0%
jan 1, 1970
50.0K
+30.0K
150.0%
jan 1, 1971
10.0K
-40.0K
-80.0%
jan 1, 1972
10.0K
0.0
0.0%
jan 1, 1973
10.0K
0.0
0.0%
jan 1, 2008
290.0K
+280.0K
2.8K%
jan 1, 2009
1.14 mln
+850.0K
293.1%
jan 1, 2010
1.86 mln
+720.0K
63.16%
jan 1, 2011
1.58 mln
-280.0K
-15.05%
jan 1, 2012
16.87 mln
+15.29 mln
967.72%
jan 1, 2013
15.68 mln
-1.19 mln
-7.05%
jan 1, 2014
24.7 mln
+9.02 mln
57.53%
jan 1, 2015
47.19 mln
+22.49 mln
91.05%
Ranking of countries by current statistics by years
