30
/
AIzaSyAYiBZKx7MnpbEhh9jyipgxe19OcubqV5w
April 1, 2024
102751
Central African Republic
CAF
true
2
1
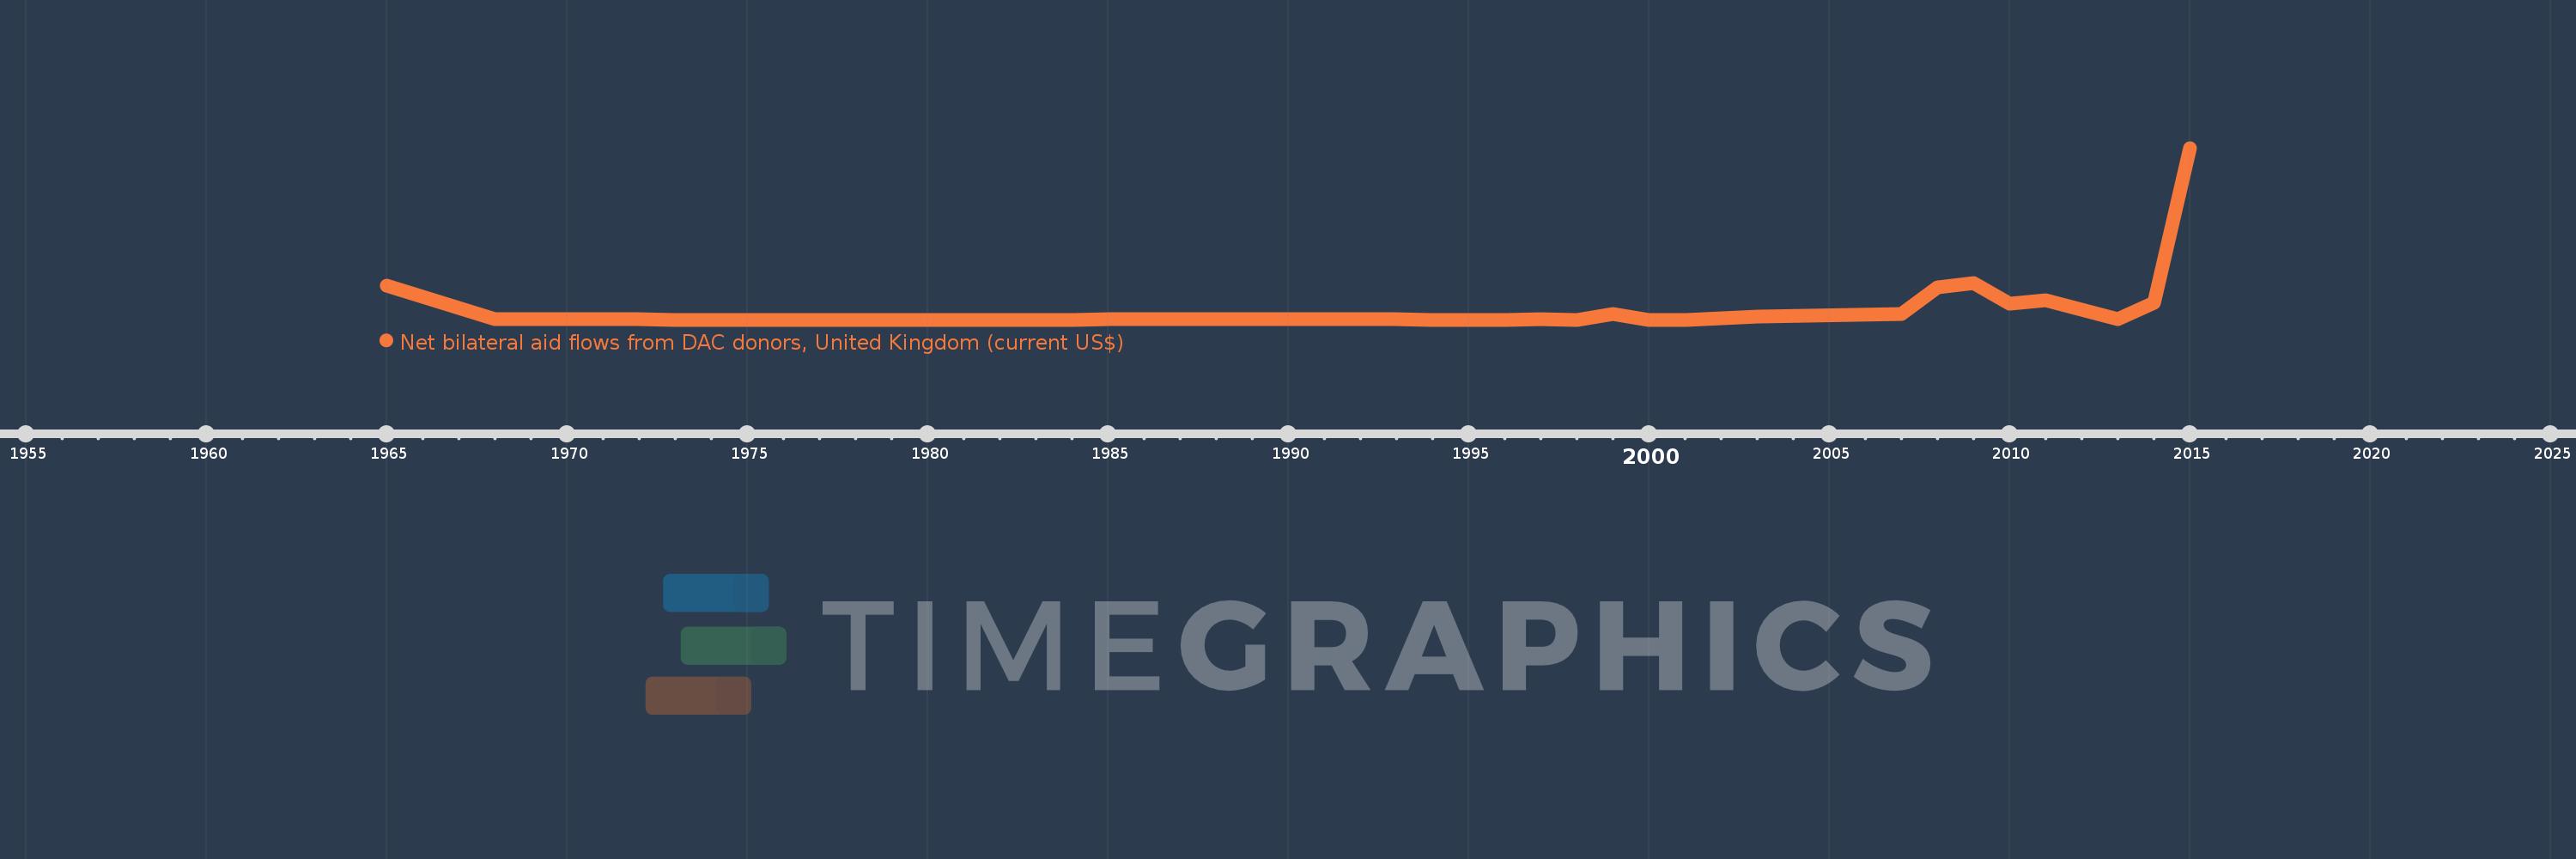
Net bilateral aid flows from DAC donors, United Kingdom (current US$)
2015,2014,2013,2011,2010,2009,2008,2007,2003,2001,2000,1999,1998,1997,1996,1995,1994,1993,1992,1991,1990,1989,1987,1986,1985,1984,1973,1972,1971,1970,1969,1968,1965
