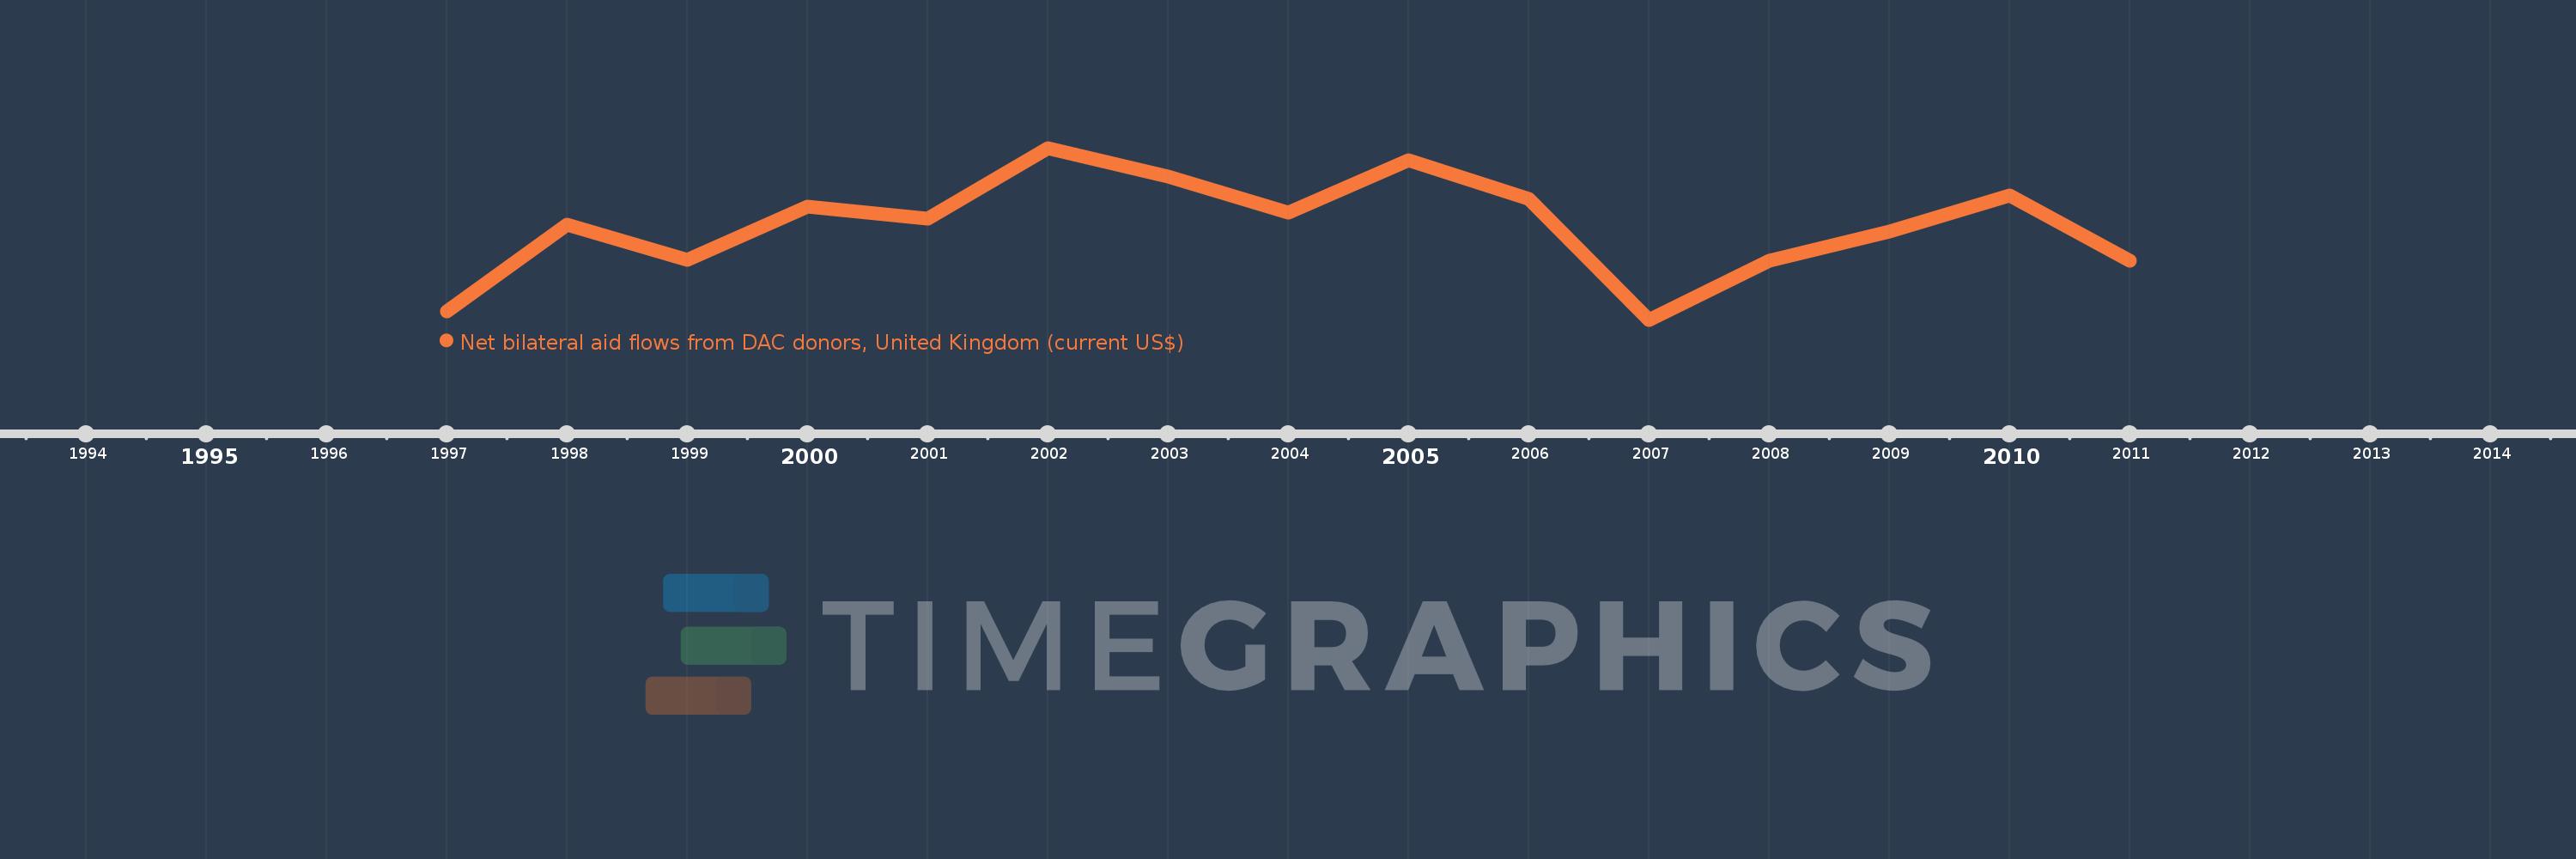
This timeline shows a graph from 1997 to 2011 of Croatia. No data until 1996. Number of actual observations by date: 15.
Source name:
World Development Indicators
Source organization:
Development Assistance Committee of the Organisation for Economic Co-operation and Development, Geographical Distribution of Financial Flows to Developing Countries, Development Co-operation Report, and International Development Statistics database. Data are available online at: www.oecd.org/dac/stats/idsonline.
Categories, topics:
Aid Effectiveness
Last updated:
apr 23, 2017
Indicators value changes by year
Meaning:
1.487 mln
Minimum:
310.0K
jan 1, 2007
Maximum:
2.46 mln
jan 1, 2002
At the date of observation
Value
Absolute change
Change from the previous value
jan 1, 1997
410.0K
+410.0K
0.0%
jan 1, 1998
1.5 mln
+1.09 mln
265.85%
jan 1, 1999
1.06 mln
-440.0K
-29.33%
jan 1, 2000
1.73 mln
+670.0K
63.21%
jan 1, 2001
1.57 mln
-160.0K
-9.25%
jan 1, 2002
2.46 mln
+890.0K
56.69%
jan 1, 2003
2.1 mln
-360.0K
-14.63%
jan 1, 2004
1.65 mln
-450.0K
-21.43%
jan 1, 2005
2.31 mln
+660.0K
40.0%
jan 1, 2006
1.82 mln
-490.0K
-21.21%
jan 1, 2007
310.0K
-1.51 mln
-82.97%
jan 1, 2008
1.05 mln
+740.0K
238.71%
jan 1, 2009
1.41 mln
+360.0K
34.29%
jan 1, 2010
1.87 mln
+460.0K
32.62%
jan 1, 2011
1.05 mln
-820.0K
-43.85%
Ranking of countries by current statistics by years
