29
/
en
AIzaSyAYiBZKx7MnpbEhh9jyipgxe19OcubqV5w
April 1, 2024
175201
Latvia
LVA
true
2
1
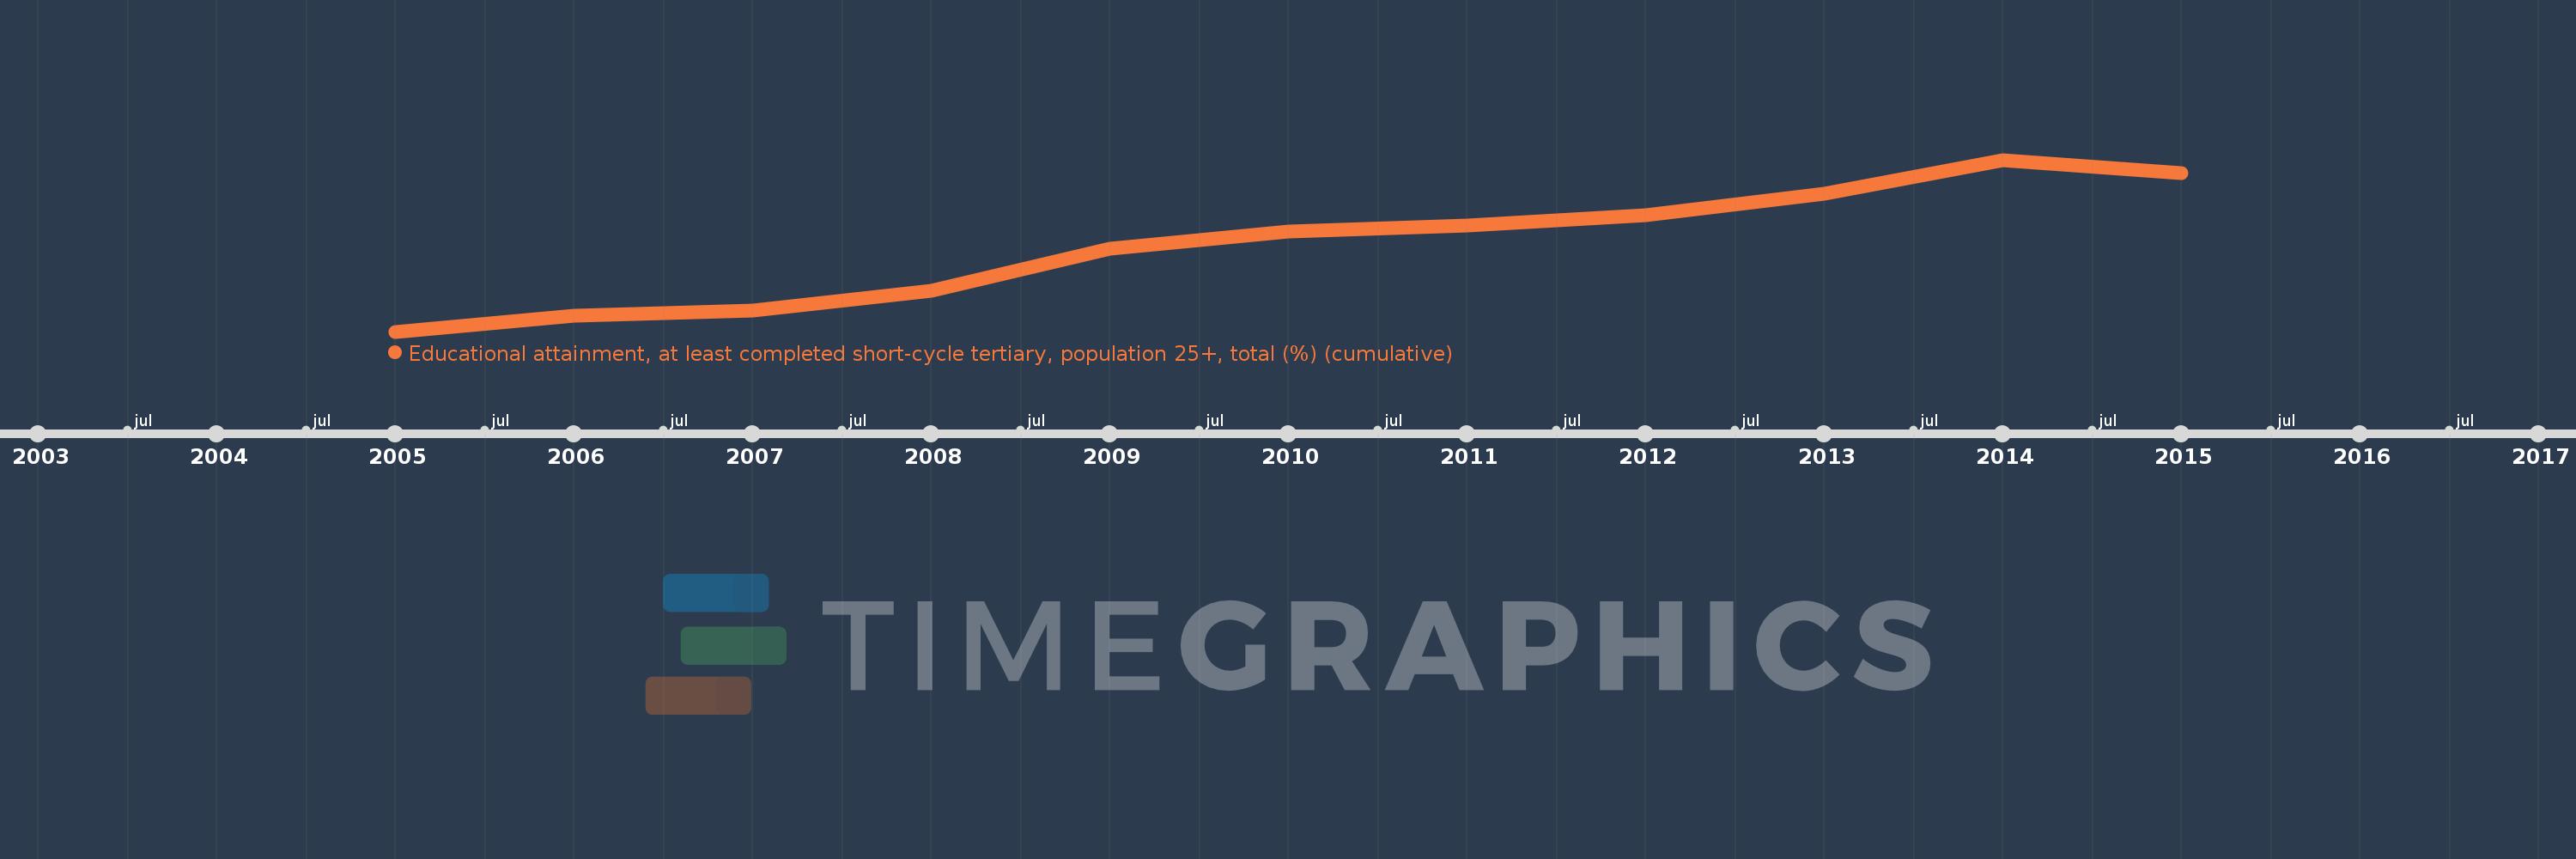
Educational attainment, at least completed short-cycle tertiary, population 25+, total (%) (cumulative)
2015,2014,2013,2012,2011,2010,2009,2008,2007,2006,2005
This statistics in other country:
Timeline:
This timeline shows a graph from 2005 to 2015 of Latvia. No data until 2004. Number of actual observations by date: 11.
Source name:
World Development Indicators
Source organization:
United Nations Educational, Scientific, and Cultural Organization (UNESCO) Institute for Statistics.
Categories, topics:
Education, Gender
Last updated:
apr 23, 2017
Indicators value changes by year
Minimum:
18.942
jan 1, 2005
Maximum:
29.342
jan 1, 2014
At the date of observation
Value
Absolute change
Change from previous value
jan 1, 2005
18.942
+18.942
0.0%
jan 1, 2006
19.881
+0.938
4.95%
jan 1, 2007
20.228
+0.347
1.75%
jan 1, 2008
21.436
+1.208
5.97%
jan 1, 2009
23.96
+2.525
11.78%
jan 1, 2010
25.002
+1.041
4.35%
jan 1, 2011
25.354
+0.352
1.41%
jan 1, 2012
26.0
+0.646
2.55%
jan 1, 2013
27.291
+1.291
4.96%
jan 1, 2014
29.342
+2.051
7.52%
jan 1, 2015
28.556
-0.786
-2.68%
Ranking of countries by current statistics by years


Comments: