29
/
en
AIzaSyAYiBZKx7MnpbEhh9jyipgxe19OcubqV5w
April 1, 2024
129224
Estonia
EST
true
2
1
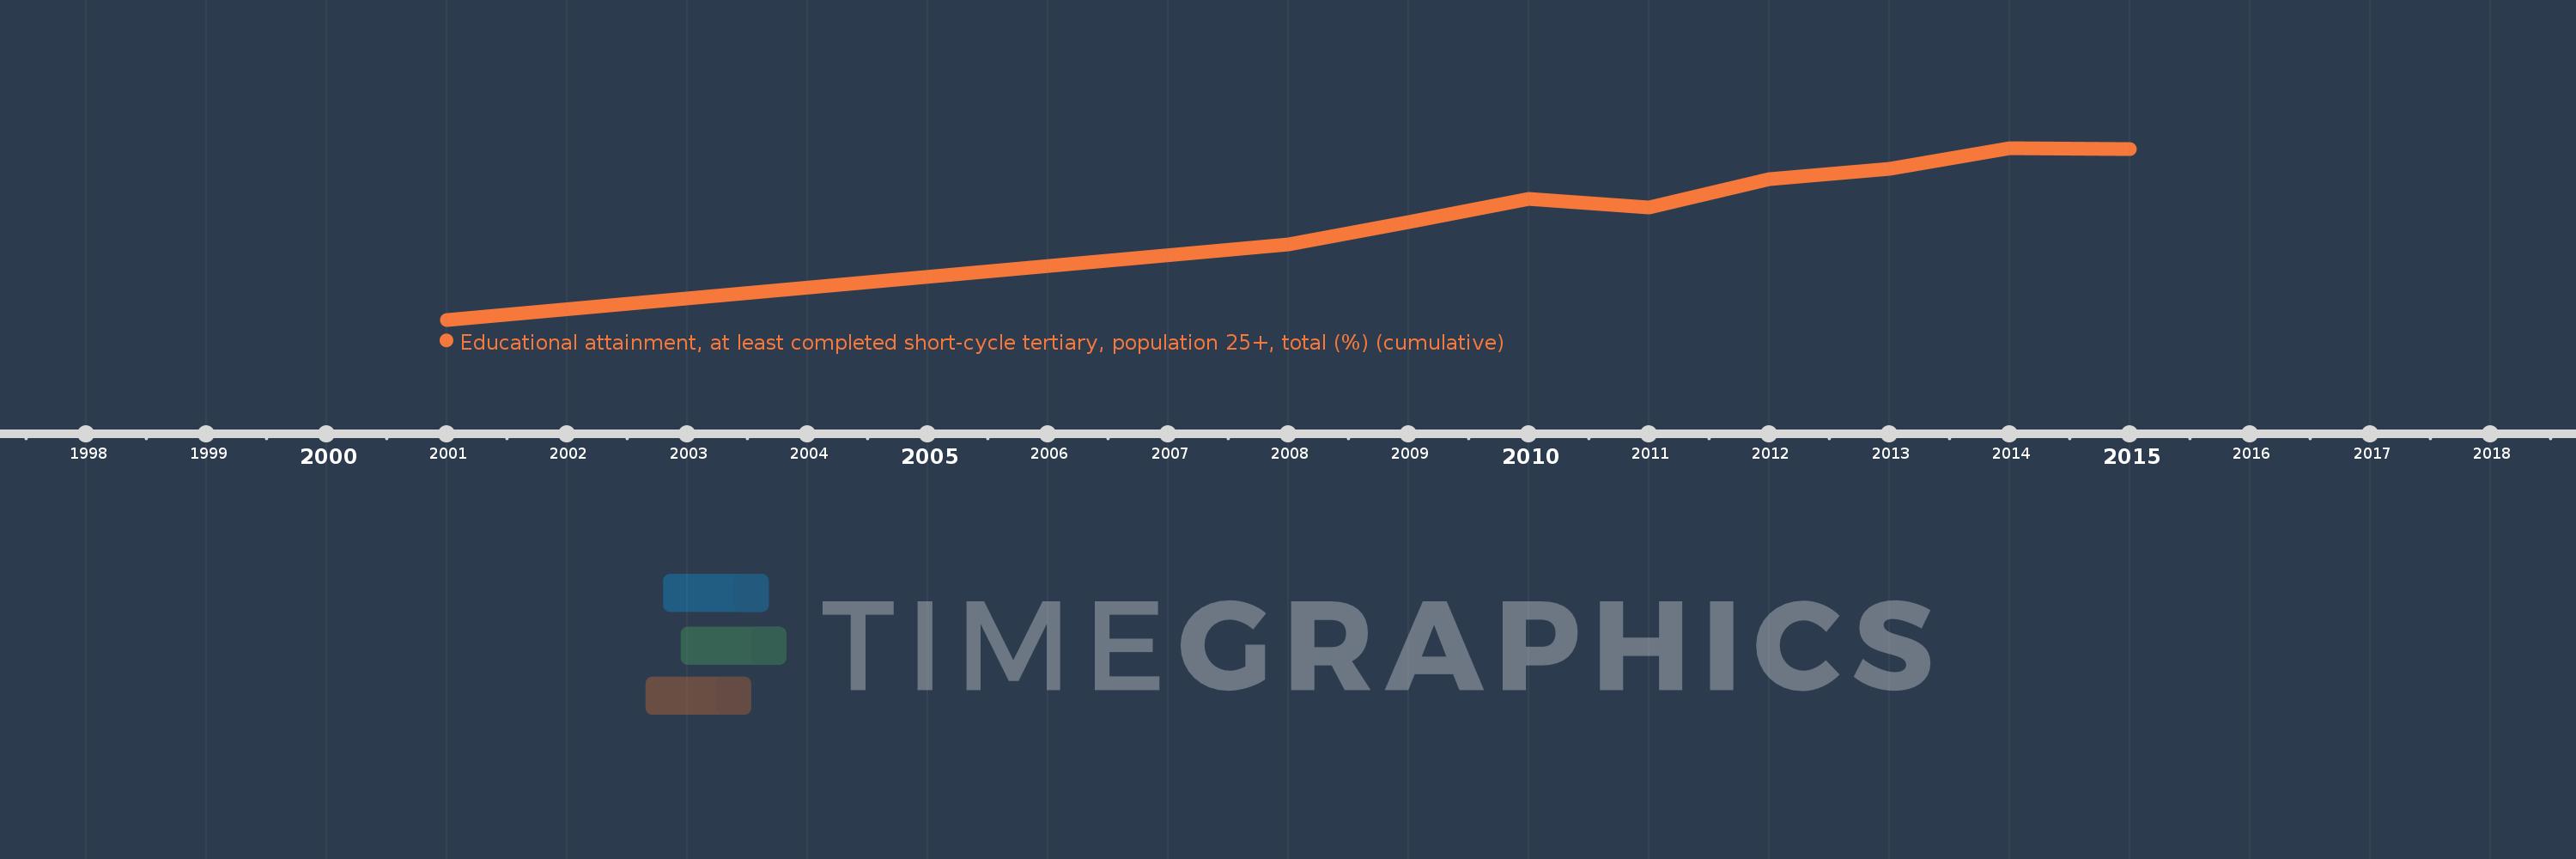
Educational attainment, at least completed short-cycle tertiary, population 25+, total (%) (cumulative)
2015,2014,2013,2012,2011,2010,2009,2008,2001
This statistics in other country:
Timeline:
This timeline shows a graph from 2001 to 2015 of Estonia. No data until 2000. Number of actual observations by date: 9.
Source name:
World Development Indicators
Source organization:
United Nations Educational, Scientific, and Cultural Organization (UNESCO) Institute for Statistics.
Categories, topics:
Education, Gender
Last updated:
apr 23, 2017
Indicators value changes by year
Minimum:
28.152
jan 1, 2001
At the date of observation
Value
Absolute change
Change from previous value
jan 1, 2001
28.152
+28.152
0.0%
jan 1, 2008
32.11
+3.957
14.06%
jan 1, 2009
33.254
+1.144
3.56%
jan 1, 2010
34.509
+1.255
3.77%
jan 1, 2011
34.029
-0.48
-1.39%
jan 1, 2012
35.53
+1.501
4.41%
jan 1, 2013
36.044
+0.514
1.45%
jan 1, 2014
37.16
+1.116
3.1%
jan 1, 2015
37.099
-0.062
-0.17%
Ranking of countries by current statistics by years


Comments: