29
/
en
AIzaSyAYiBZKx7MnpbEhh9jyipgxe19OcubqV5w
April 1, 2024
72858
Australia
AUS
true
2
1
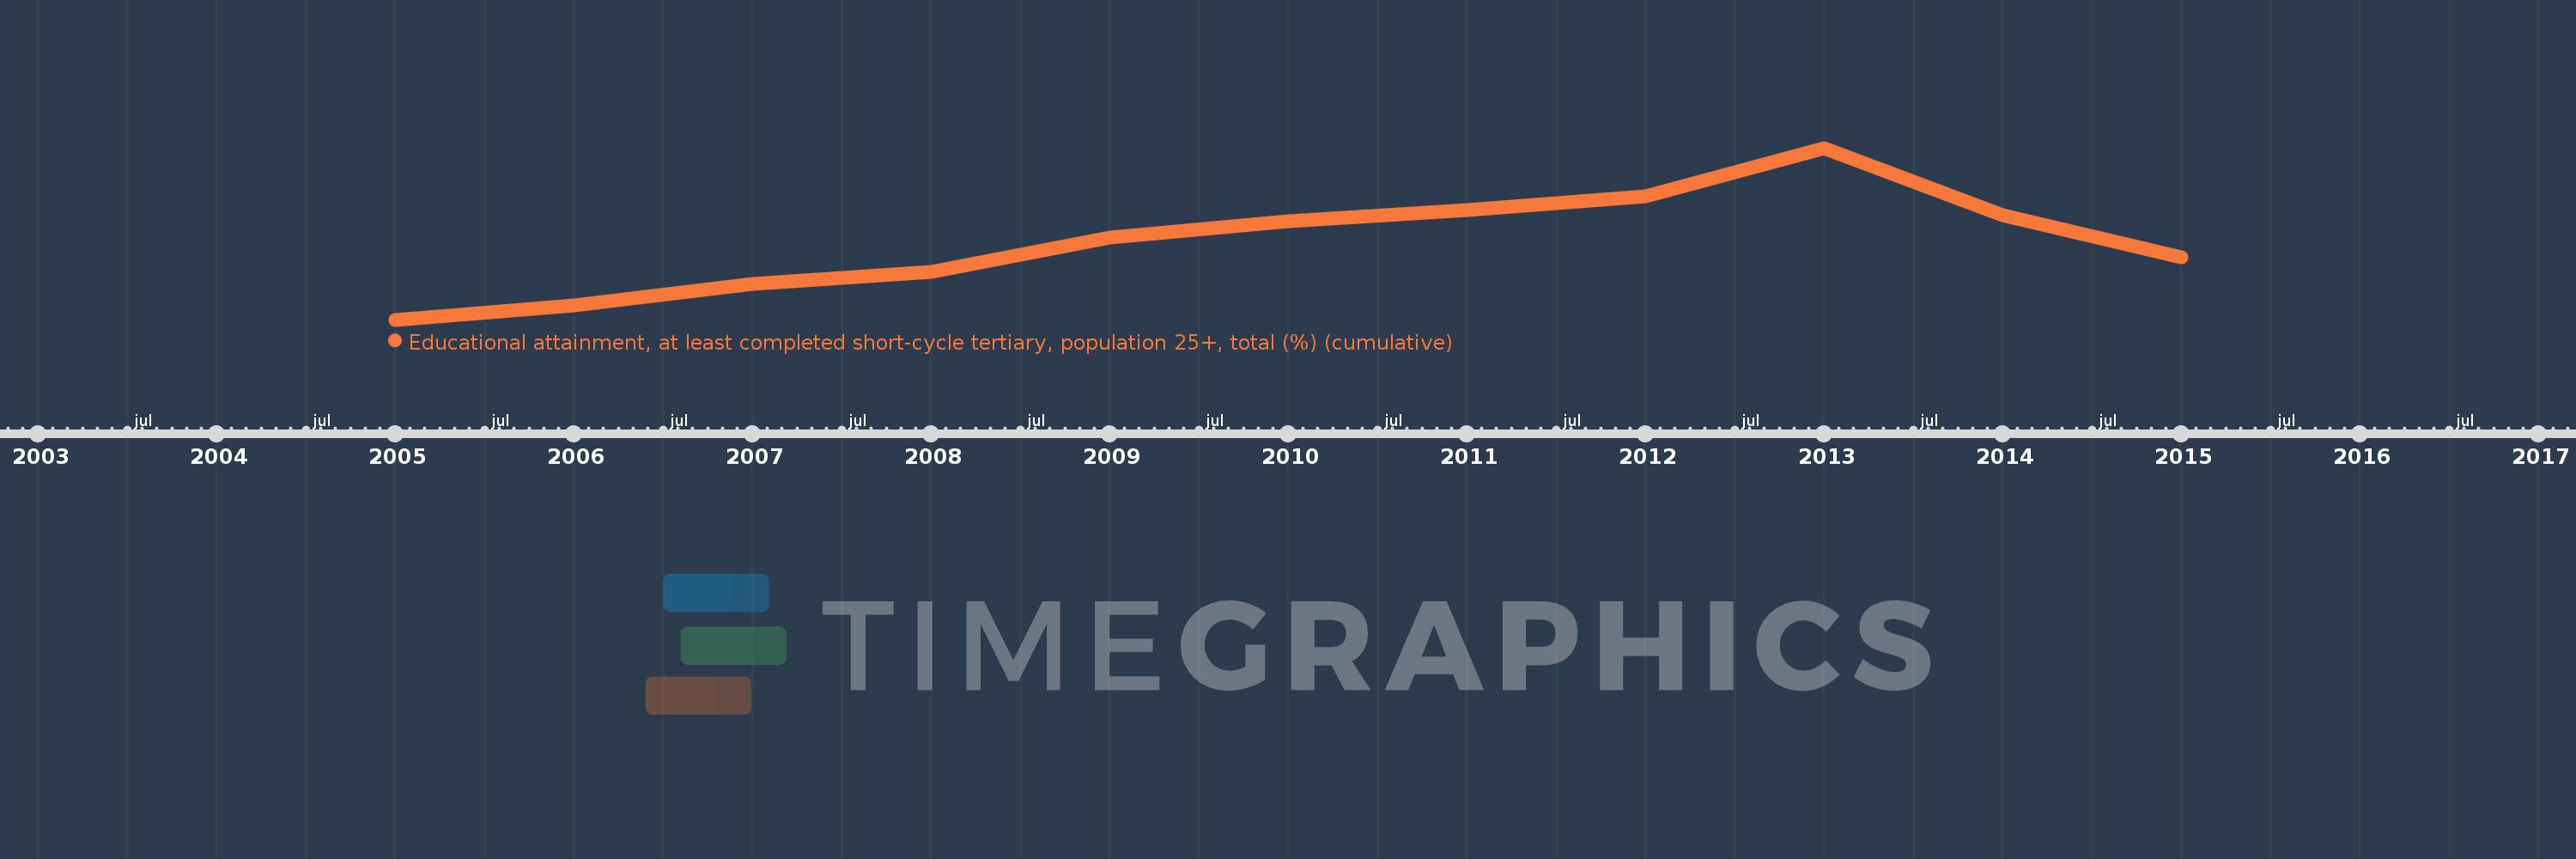
Educational attainment, at least completed short-cycle tertiary, population 25+, total (%) (cumulative)
2015,2014,2013,2012,2011,2010,2009,2008,2007,2006,2005
This statistics in other country:
Timeline:
This timeline shows a graph from 2005 to 2015 of Australia. No data until 2004. Number of actual observations by date: 11.
Source name:
World Development Indicators
Source organization:
United Nations Educational, Scientific, and Cultural Organization (UNESCO) Institute for Statistics.
Categories, topics:
Education, Gender
Last updated:
apr 23, 2017
Indicators value changes by year
Minimum:
30.823
jan 1, 2005
At the date of observation
Value
Absolute change
Change from previous value
jan 1, 2005
30.823
+30.823
0.0%
jan 1, 2006
31.691
+0.868
2.82%
jan 1, 2007
33.013
+1.322
4.17%
jan 1, 2008
33.741
+0.728
2.21%
jan 1, 2009
35.819
+2.078
6.16%
jan 1, 2010
36.803
+0.985
2.75%
jan 1, 2011
37.488
+0.685
1.86%
jan 1, 2012
38.359
+0.871
2.32%
jan 1, 2013
41.28
+2.921
7.61%
jan 1, 2014
37.206
-4.074
-9.87%
jan 1, 2015
34.632
-2.573
-6.92%
Ranking of countries by current statistics by years


Comments: