29
/
en
AIzaSyAYiBZKx7MnpbEhh9jyipgxe19OcubqV5w
April 1, 2024
163081
Jamaica
JAM
true
2
1
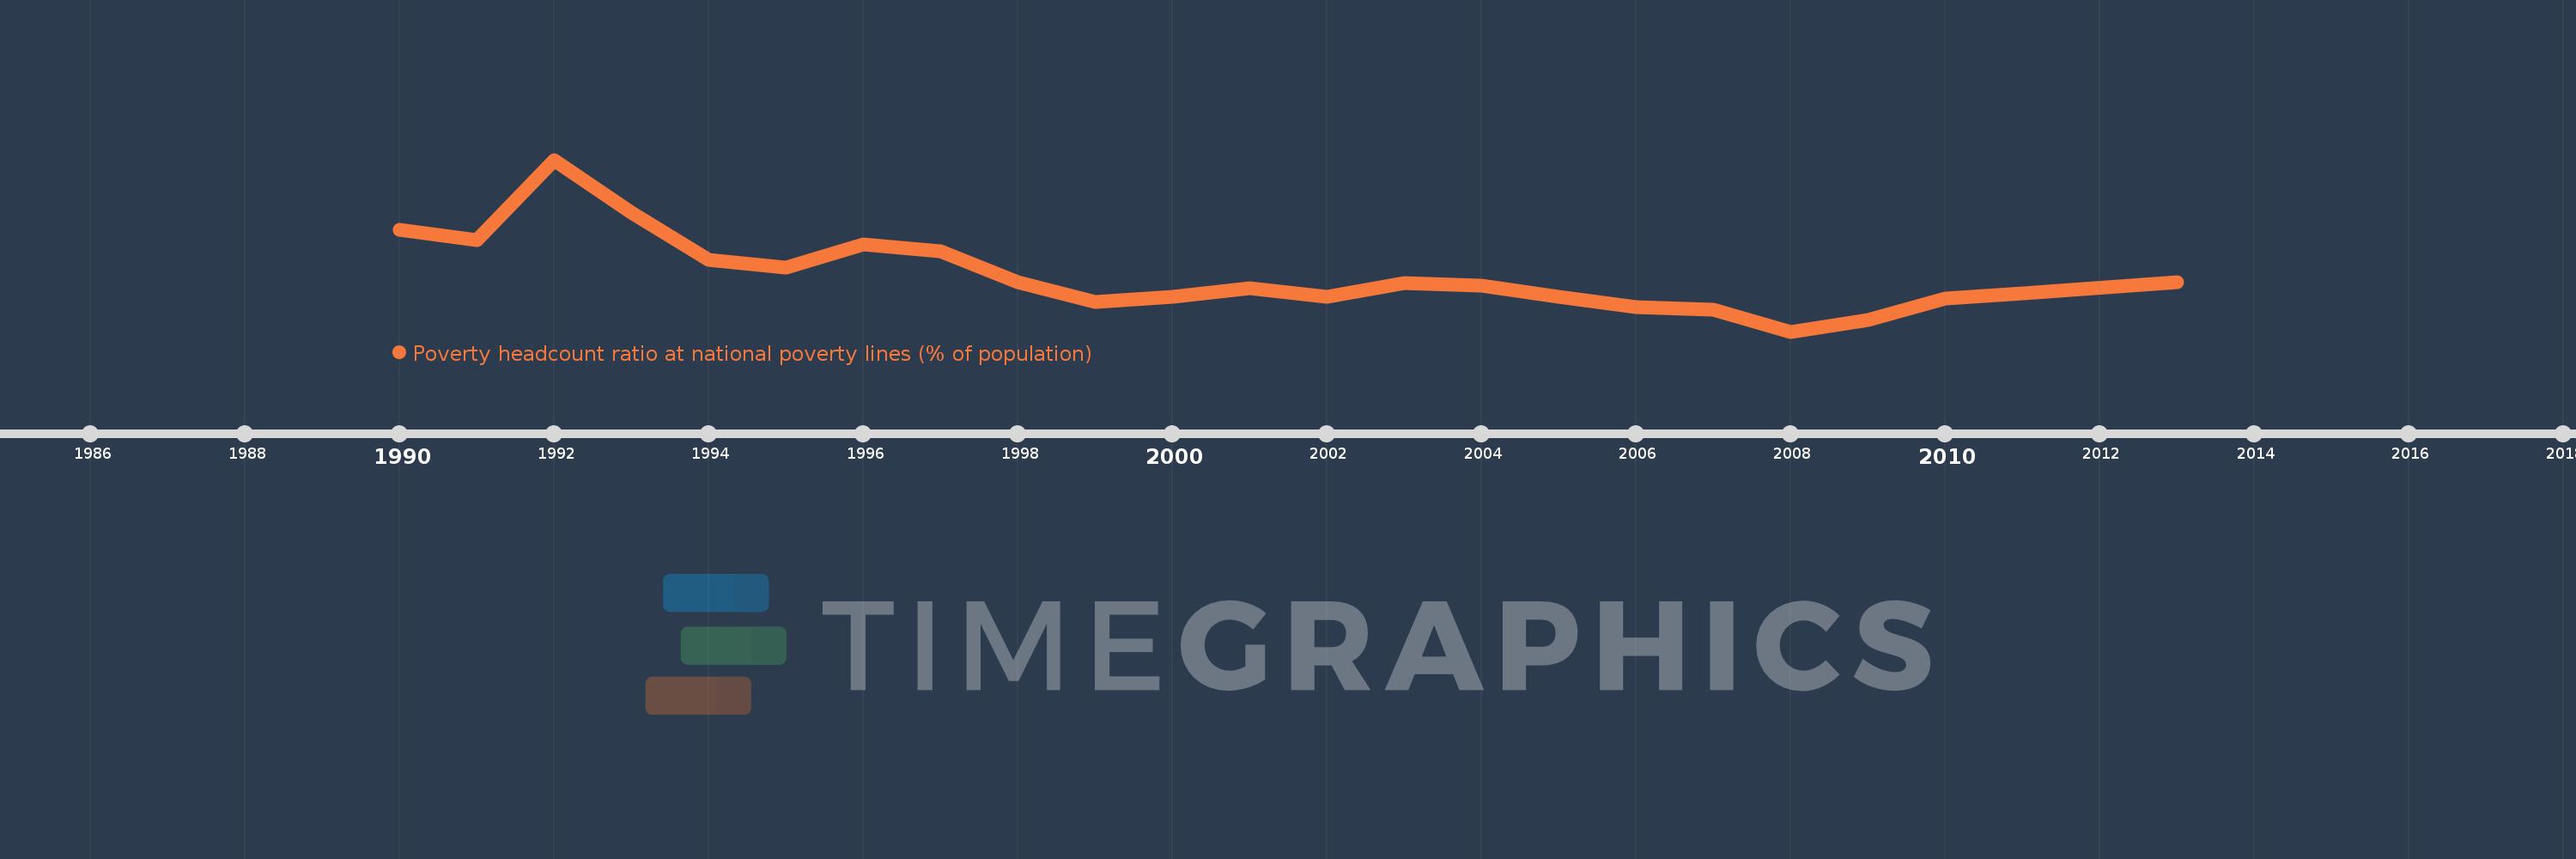
Poverty headcount ratio at national poverty lines (% of population)
2013,2011,2010,2009,2008,2007,2006,2005,2004,2003,2002,2001,2000,1999,1998,1997,1996,1995,1994,1993,1992,1991,1990
This statistics in other country:
Timeline:
This timeline shows a graph from 1990 to 2013 of Jamaica. No data until 1989. Number of actual observations by date: 23.
Source name:
World Development Indicators
Source organization:
World Bank, Global Poverty Working Group. Data are compiled from official government sources or are computed by World Bank staff using national (i.e. country–specific) poverty lines.
Categories, topics:
Poverty
Last updated:
apr 23, 2017
Indicators value changes by year
At the date of observation
Value
Absolute change
Change from previous value
jan 1, 1990
30.5
+30.5
0.0%
jan 1, 1991
28.4
-2.1
-6.89%
jan 1, 1992
44.6
+16.2
57.04%
jan 1, 1993
33.9
-10.7
-23.99%
jan 1, 1994
24.4
-9.5
-28.02%
jan 1, 1995
22.8
-1.6
-6.56%
jan 1, 1996
27.5
+4.7
20.61%
jan 1, 1997
26.1
-1.4
-5.09%
jan 1, 1998
19.9
-6.2
-23.75%
jan 1, 1999
15.9
-4.0
-20.1%
jan 1, 2000
16.9
+1.0
6.29%
jan 1, 2001
18.7
+1.8
10.65%
jan 1, 2002
16.9
-1.8
-9.63%
jan 1, 2003
19.7
+2.8
16.57%
jan 1, 2004
19.1
-0.6
-3.05%
jan 1, 2005
16.9
-2.2
-11.52%
jan 1, 2006
14.8
-2.1
-12.43%
jan 1, 2007
14.3
-0.5
-3.38%
jan 1, 2008
9.9
-4.4
-30.77%
jan 1, 2009
12.3
+2.4
24.24%
jan 1, 2010
16.5
+4.2
34.15%
jan 1, 2011
17.6
+1.1
6.67%
jan 1, 2013
19.9
+2.3
13.07%
Ranking of countries by current statistics by years


Comments: