29
/
en
AIzaSyAYiBZKx7MnpbEhh9jyipgxe19OcubqV5w
April 1, 2024
284002
West Bank and Gaza
PSE
true
2
1
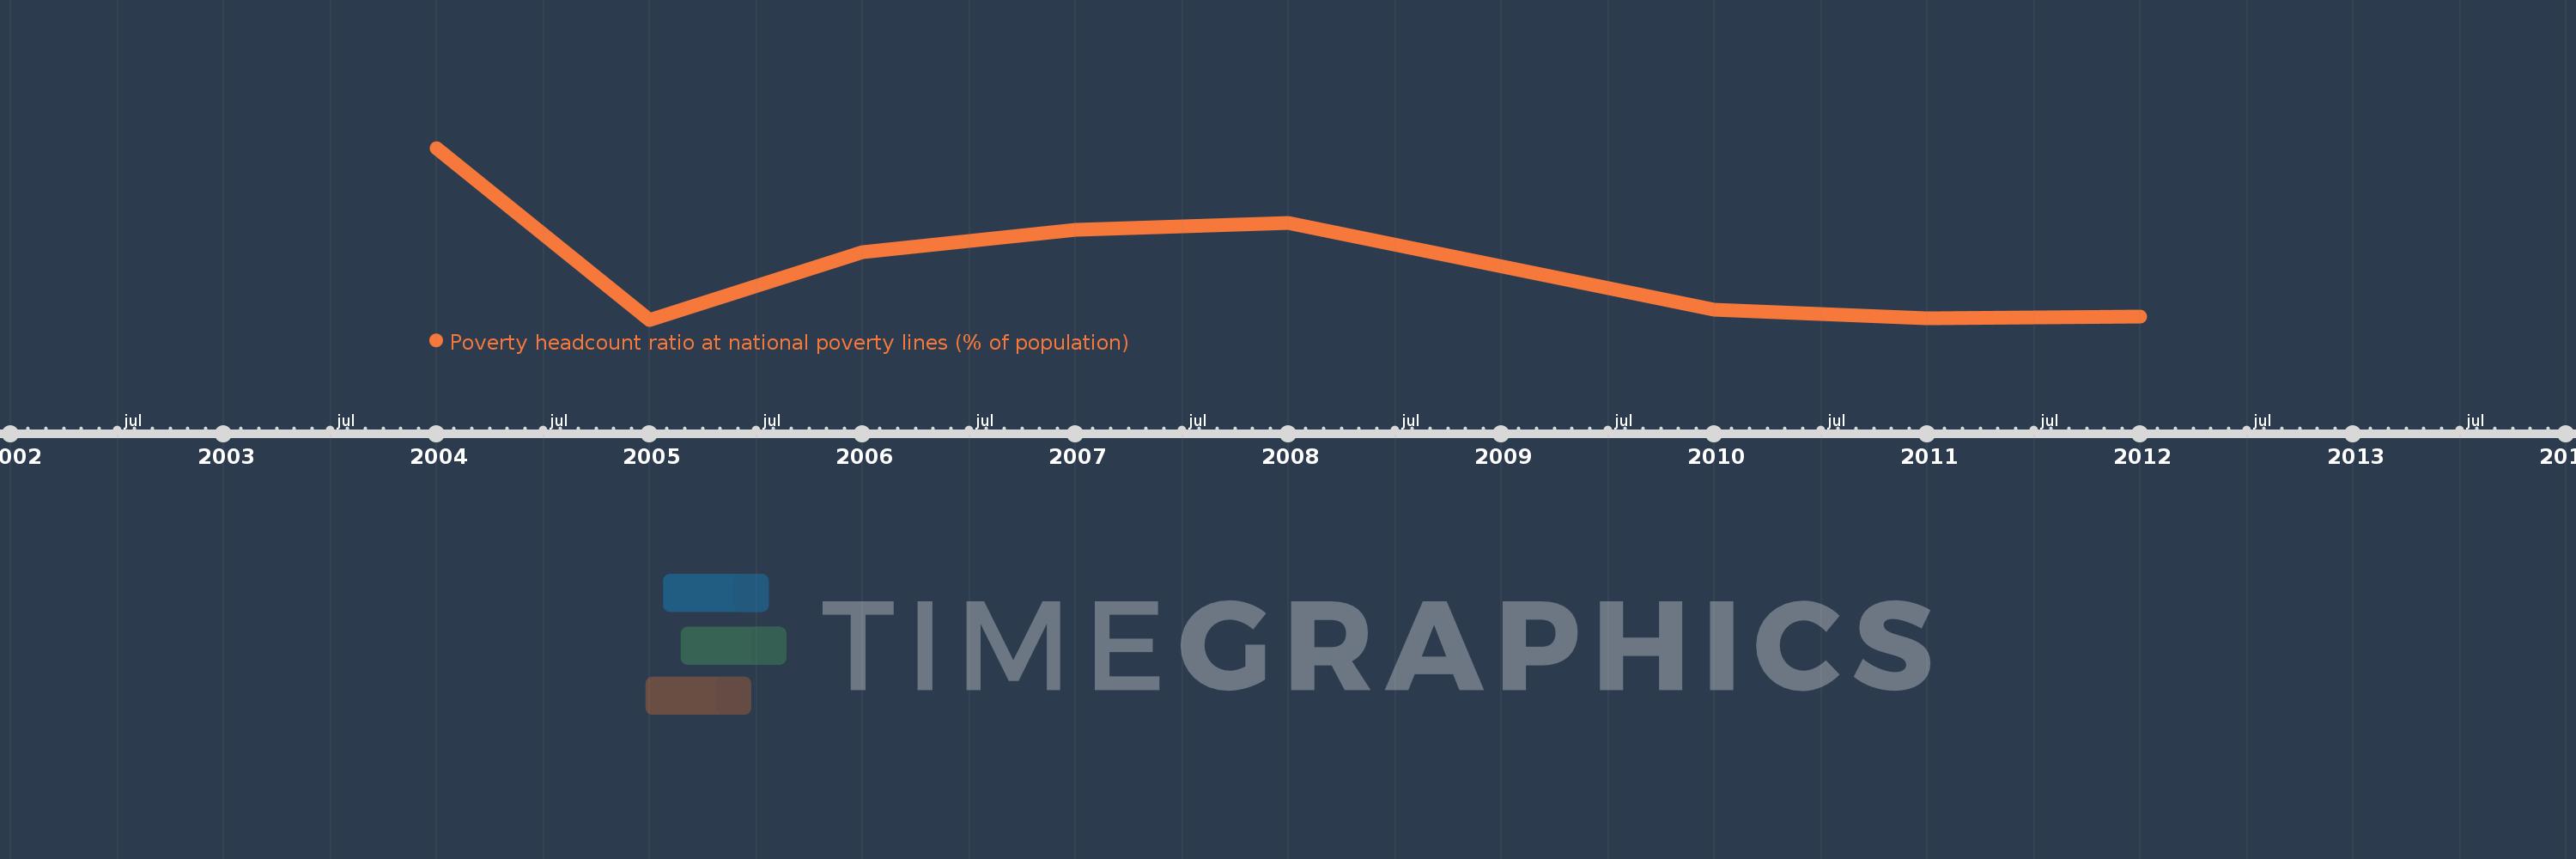
Poverty headcount ratio at national poverty lines (% of population)
2012,2011,2010,2008,2007,2006,2005,2004
This statistics in other country:
Timeline:
This timeline shows a graph from 2004 to 2012 of West Bank and Gaza. No data until 2003. Number of actual observations by date: 8.
Source name:
World Development Indicators
Source organization:
World Bank, Global Poverty Working Group. Data are compiled from official government sources or are computed by World Bank staff using national (i.e. country–specific) poverty lines.
Categories, topics:
Poverty
Last updated:
apr 23, 2017
Indicators value changes by year
At the date of observation
Value
Absolute change
Change from previous value
jan 1, 2004
35.5
+35.5
0.0%
jan 1, 2005
25.6
-9.9
-27.89%
jan 1, 2006
29.5
+3.9
15.23%
jan 1, 2007
30.8
+1.3
4.41%
jan 1, 2008
31.2
+0.4
1.3%
jan 1, 2010
26.2
-5.0
-16.03%
jan 1, 2011
25.7
-0.5
-1.91%
jan 1, 2012
25.8
+0.1
0.39%
Ranking of countries by current statistics by years


Comments: