29
/
en
AIzaSyAYiBZKx7MnpbEhh9jyipgxe19OcubqV5w
April 1, 2024
249254
Sri Lanka
LKA
true
2
1
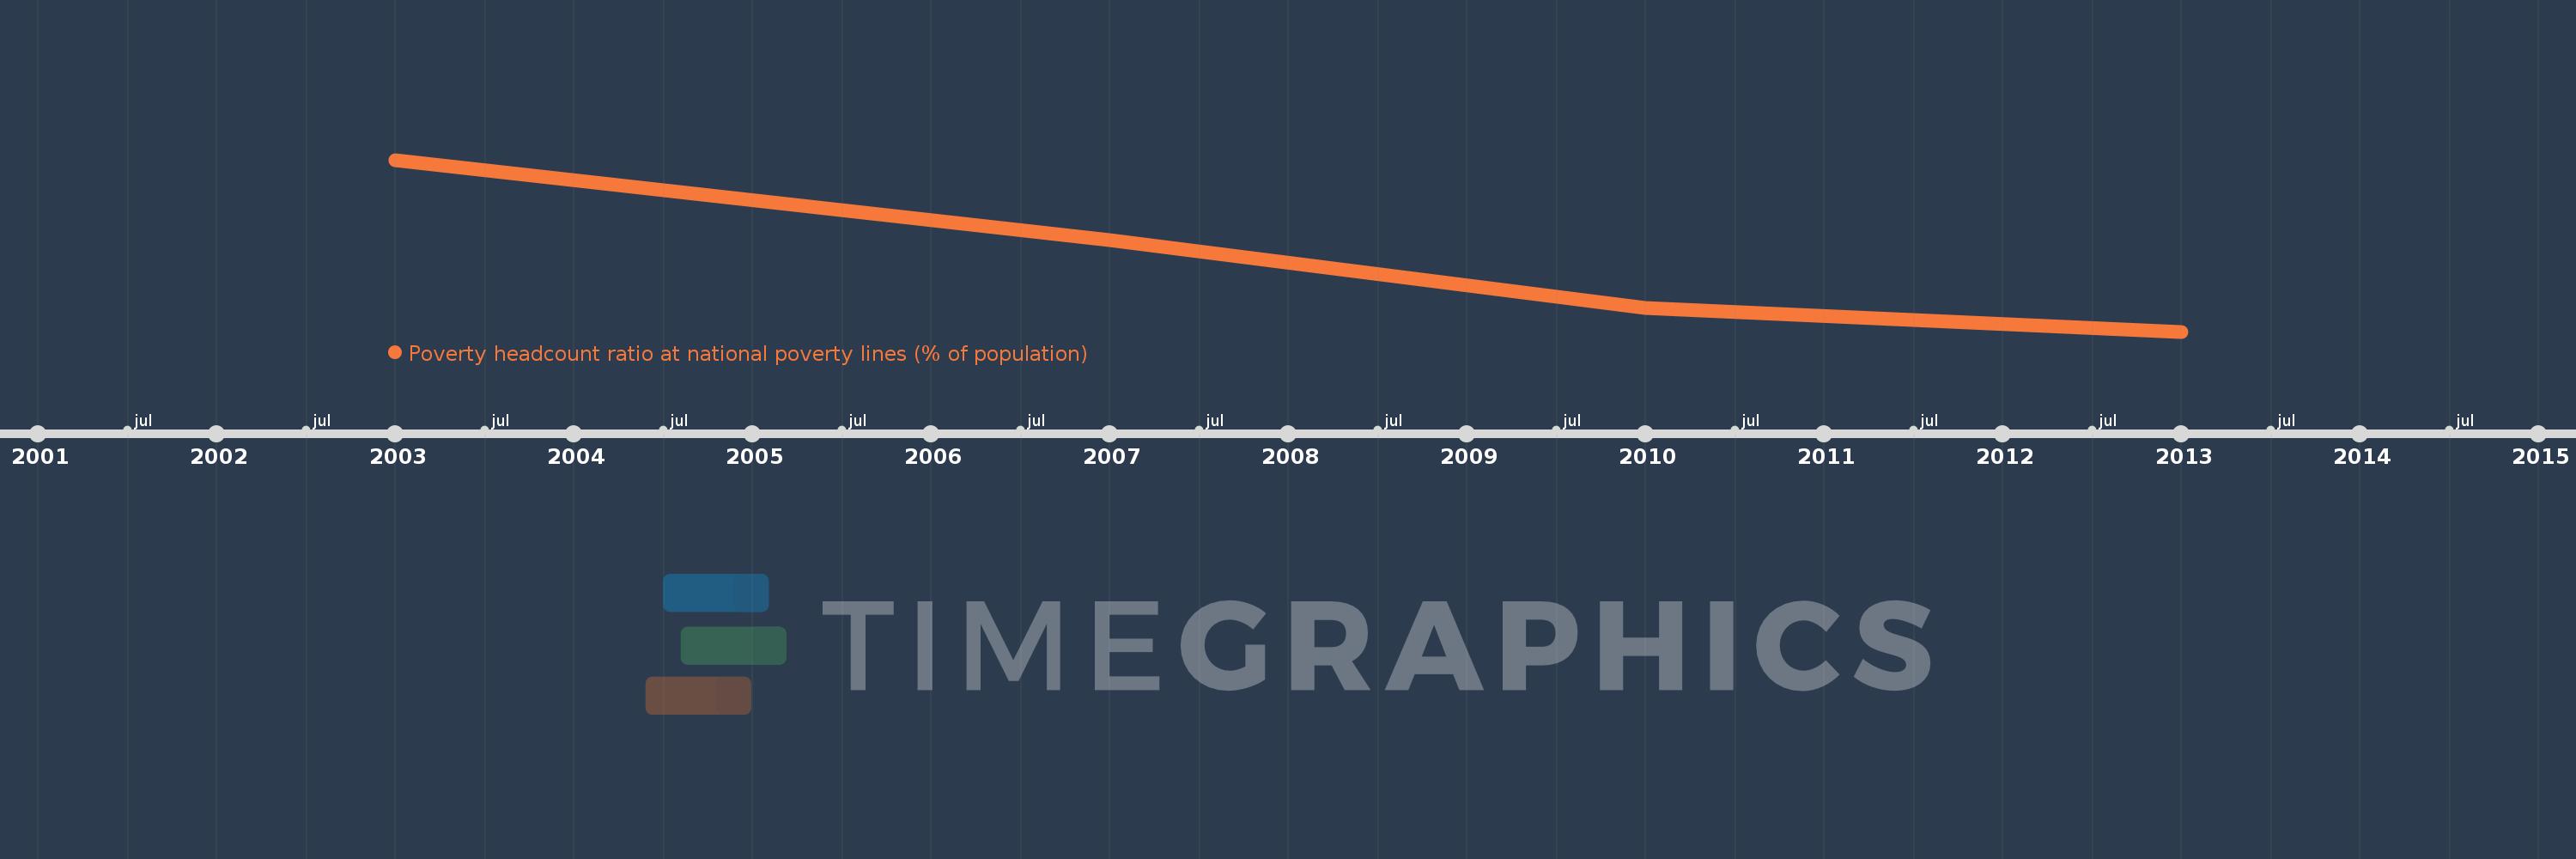
Poverty headcount ratio at national poverty lines (% of population)
2013,2010,2007,2003
This statistics in other country:
Timeline:
This timeline shows a graph from 2003 to 2013 of Sri Lanka. No data until 2002. Number of actual observations by date: 4.
Source name:
World Development Indicators
Source organization:
World Bank, Global Poverty Working Group. Data are compiled from official government sources or are computed by World Bank staff using national (i.e. country–specific) poverty lines.
Categories, topics:
Poverty
Last updated:
apr 23, 2017
Indicators value changes by year
At the date of observation
Value
Absolute change
Change from previous value
jan 1, 2003
22.7
+22.7
0.0%
jan 1, 2007
15.2
-7.5
-33.04%
jan 1, 2010
8.9
-6.3
-41.45%
jan 1, 2013
6.7
-2.2
-24.72%
Ranking of countries by current statistics by years


Comments: