30
/
AIzaSyAYiBZKx7MnpbEhh9jyipgxe19OcubqV5w
April 1, 2024
147290
Guinea-Bissau
GNB
true
2
1
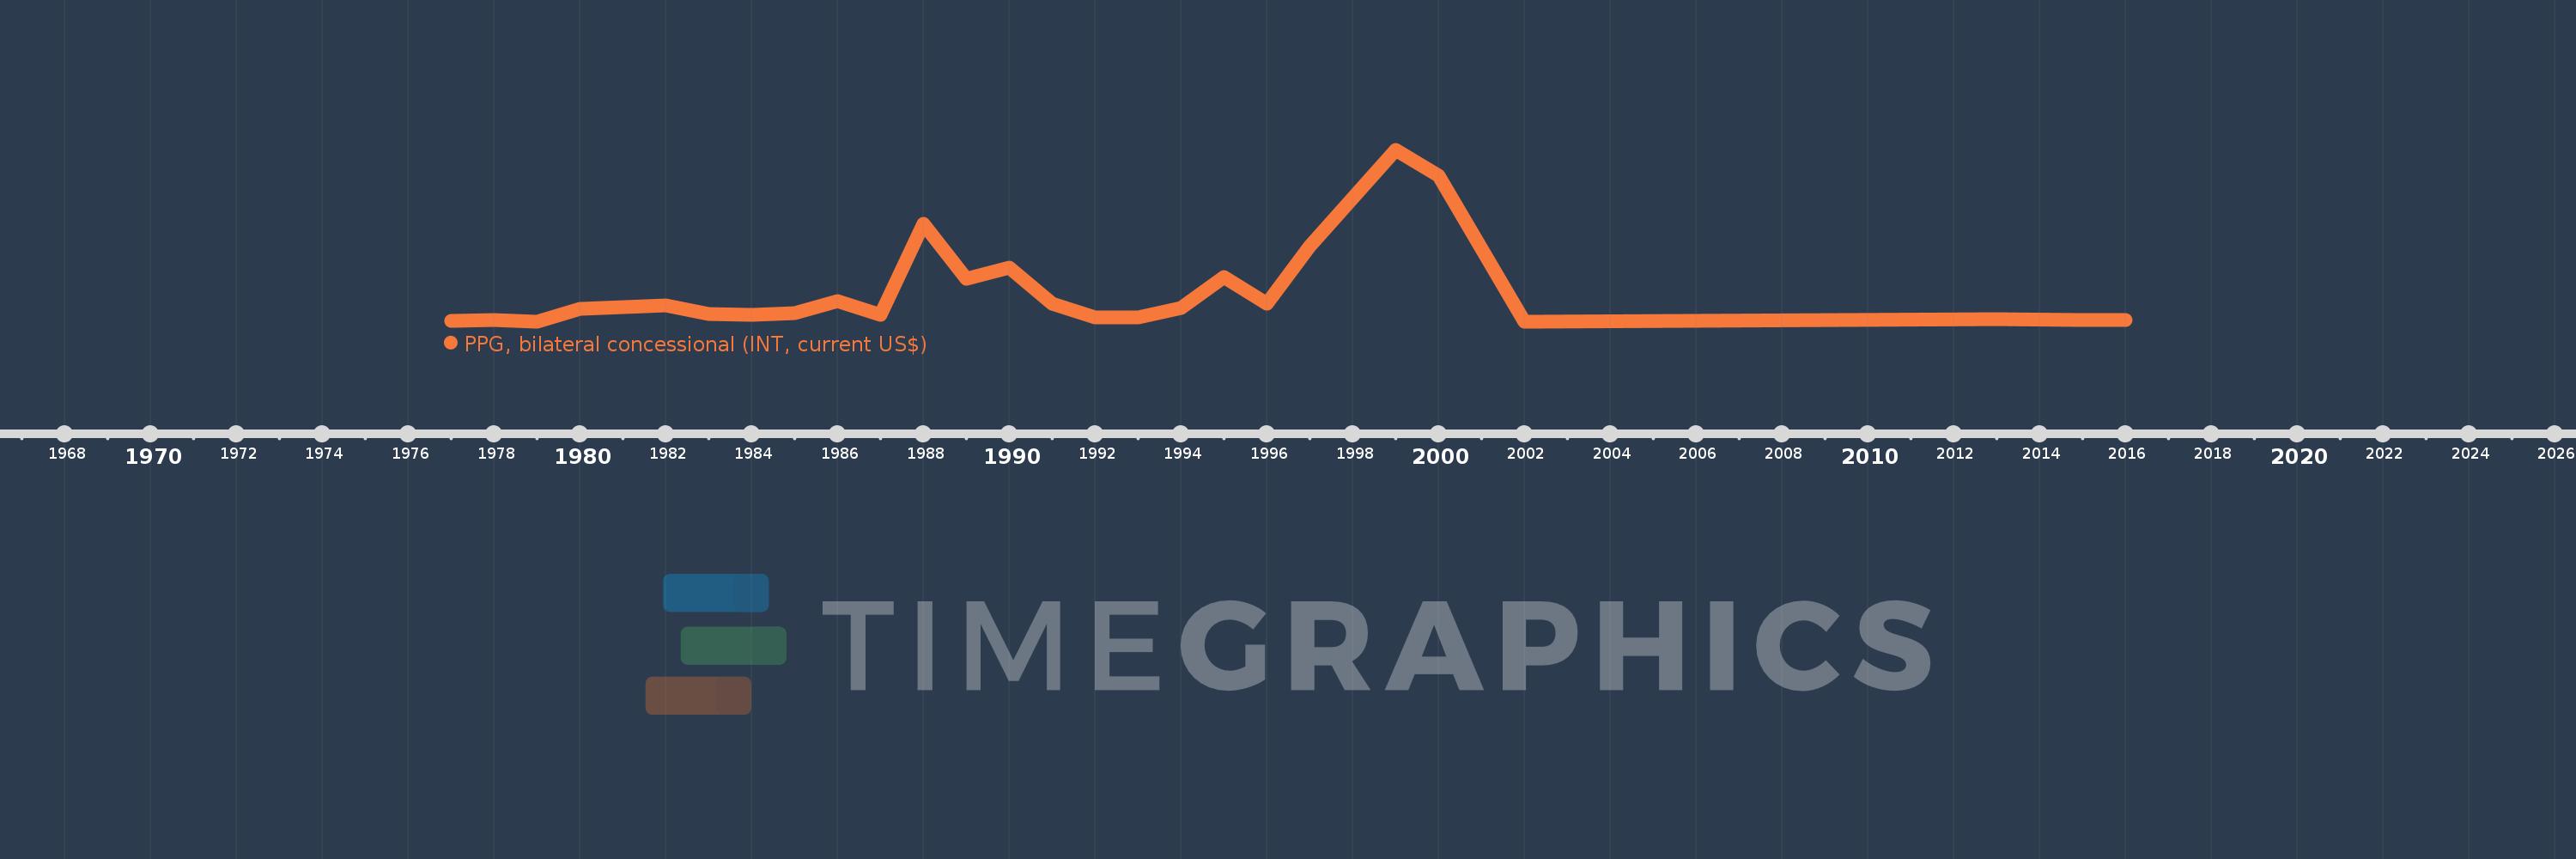
PPG, bilateral concessional (INT, current US$)
2016,2015,2013,2002,2000,1999,1997,1996,1995,1994,1993,1992,1991,1990,1989,1988,1987,1986,1985,1984,1983,1982,1981,1980,1979,1978,1977
