29
/
en
AIzaSyAYiBZKx7MnpbEhh9jyipgxe19OcubqV5w
April 1, 2024
232641
Samoa
WSM
true
2
1
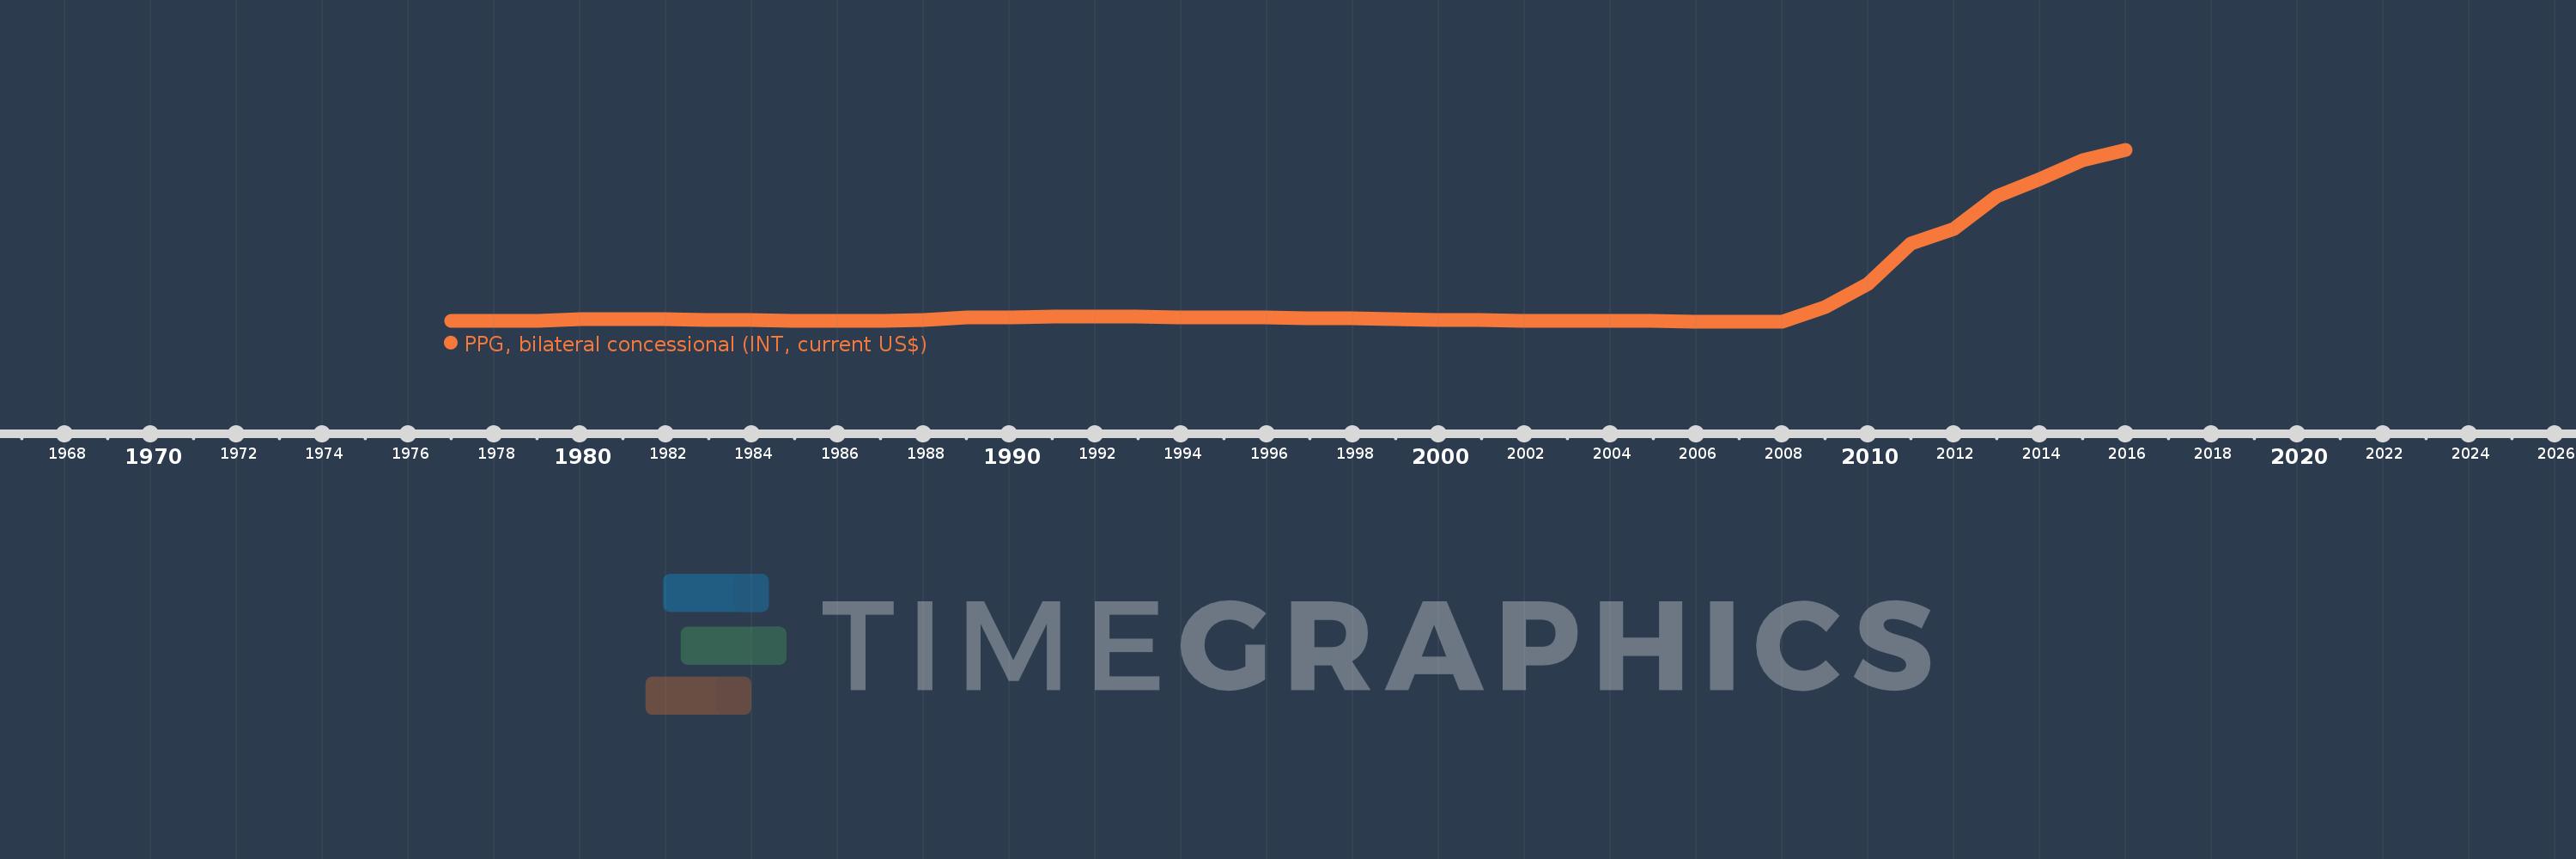
PPG, bilateral concessional (INT, current US$)
2016,2015,2014,2013,2012,2011,2010,2009,2008,2007,2006,2005,2004,2003,2002,2001,2000,1999,1998,1997,1996,1995,1994,1993,1992,1991,1990,1989,1988,1987,1986,1985,1984,1983,1982,1981,1980,1979,1978,1977
This statistics in other country:
Timeline:
This timeline shows a graph from 1977 to 2016 of Samoa. No data until 1976. Number of actual observations by date: 40.
Source name:
World Development Indicators
Source organization:
World Bank, International Debt Statistics.
Categories, topics:
External Debt
Last updated:
apr 23, 2017
Indicators value changes by year
Maximum:
3.491 mln
jan 1, 2016
At the date of observation
Value
Absolute change
Change from previous value
jan 1, 1977
30.0K
+30.0K
0.0%
jan 1, 1978
29.0K
-1000.0
-3.33%
jan 1, 1979
31.0K
+2.0K
6.9%
jan 1, 1980
64.0K
+33.0K
106.45%
jan 1, 1981
61.0K
-3.0K
-4.69%
jan 1, 1982
55.0K
-6.0K
-9.84%
jan 1, 1983
47.0K
-8.0K
-14.55%
jan 1, 1984
36.0K
-11.0K
-23.4%
jan 1, 1985
31.0K
-5.0K
-13.89%
jan 1, 1986
26.0K
-5.0K
-16.13%
jan 1, 1987
26.0K
0.0
0.0%
jan 1, 1988
47.0K
+21.0K
80.77%
jan 1, 1989
88.0K
+41.0K
87.23%
jan 1, 1990
96.0K
+8.0K
9.09%
jan 1, 1991
105.0K
+9.0K
9.38%
jan 1, 1992
105.0K
0.0
0.0%
jan 1, 1993
106.0K
+1000.0
0.95%
jan 1, 1994
93.0K
-13.0K
-12.26%
jan 1, 1995
98.0K
+5.0K
5.38%
jan 1, 1996
89.0K
-9.0K
-9.18%
jan 1, 1997
81.0K
-8.0K
-8.99%
jan 1, 1998
74.0K
-7.0K
-8.64%
jan 1, 1999
65.0K
-9.0K
-12.16%
jan 1, 2000
47.0K
-18.0K
-27.69%
jan 1, 2001
46.0K
-1000.0
-2.13%
jan 1, 2002
33.0K
-13.0K
-28.26%
jan 1, 2003
26.0K
-7.0K
-21.21%
jan 1, 2004
23.0K
-3.0K
-11.54%
jan 1, 2005
18.0K
-5.0K
-21.74%
jan 1, 2006
12.0K
-6.0K
-33.33%
jan 1, 2007
4.0K
-8.0K
-66.67%
jan 1, 2008
3.0K
-1000.0
-25.0%
jan 1, 2009
306.0K
+303.0K
10.1K%
jan 1, 2010
782.0K
+476.0K
155.56%
jan 1, 2011
1.594 mln
+812.0K
103.84%
jan 1, 2012
1.892 mln
+298.0K
18.7%
jan 1, 2013
2.549 mln
+657.0K
34.73%
jan 1, 2014
2.903 mln
+354.0K
13.89%
jan 1, 2015
3.281 mln
+378.0K
13.02%
jan 1, 2016
3.491 mln
+210.0K
6.4%
Ranking of countries by current statistics by years


Comments: