29
/
en
AIzaSyAYiBZKx7MnpbEhh9jyipgxe19OcubqV5w
April 1, 2024
108950
Comoros
COM
true
2
1
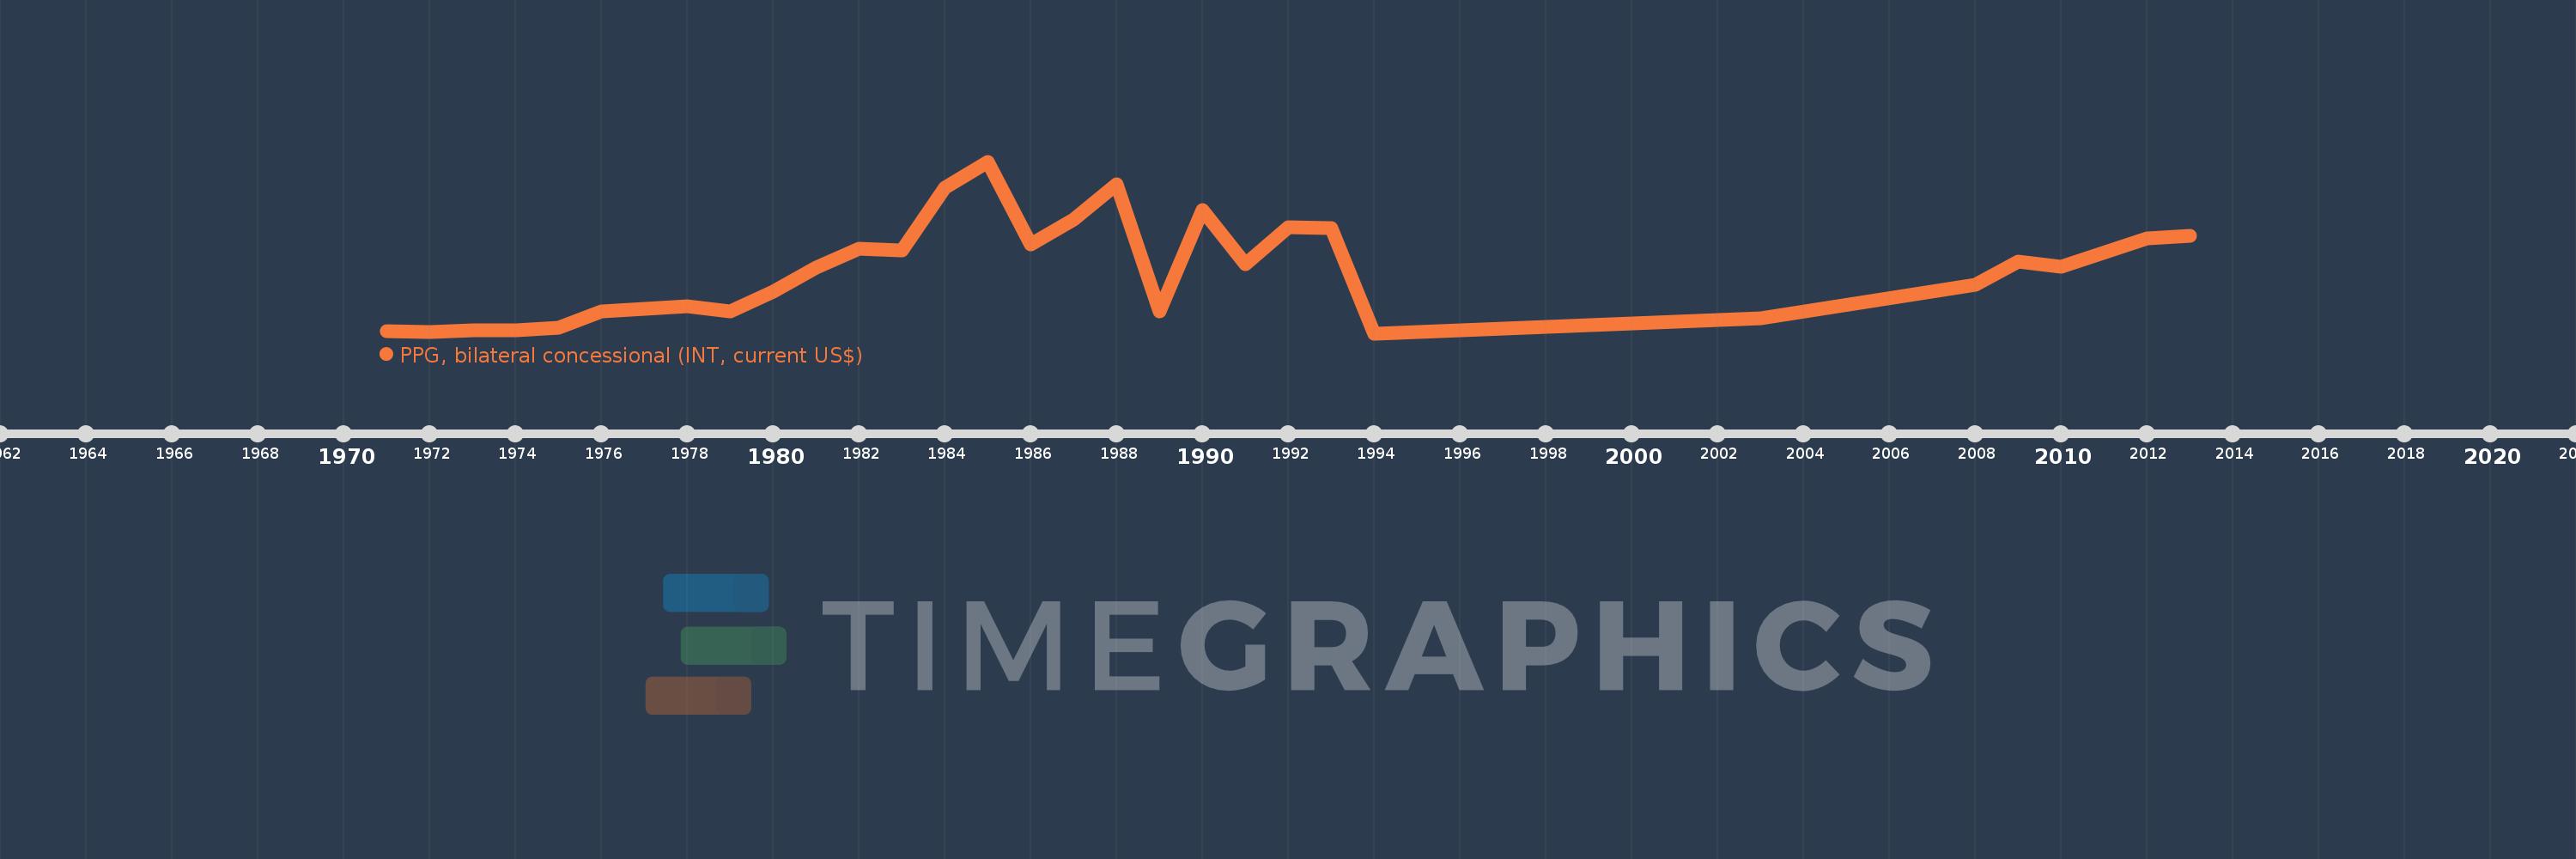
PPG, bilateral concessional (INT, current US$)
2013,2012,2010,2009,2008,2003,1994,1993,1992,1991,1990,1989,1988,1987,1986,1985,1984,1983,1982,1981,1980,1979,1978,1977,1976,1975,1974,1973,1972,1971
This statistics in other country:
Timeline:
This timeline shows a graph from 1971 to 2013 of Comoros. No data until 1970. Number of actual observations by date: 30.
Source name:
World Development Indicators
Source organization:
World Bank, International Debt Statistics.
Categories, topics:
External Debt
Last updated:
apr 23, 2017
Indicators value changes by year
Maximum:
670.0K
jan 1, 1985
At the date of observation
Value
Absolute change
Change from previous value
jan 1, 1971
15.0K
+15.0K
0.0%
jan 1, 1972
13.0K
-2.0K
-13.33%
jan 1, 1973
18.0K
+5.0K
38.46%
jan 1, 1974
21.0K
+3.0K
16.67%
jan 1, 1975
28.0K
+7.0K
33.33%
jan 1, 1976
94.0K
+66.0K
235.71%
jan 1, 1977
102.0K
+8.0K
8.51%
jan 1, 1978
112.0K
+10.0K
9.8%
jan 1, 1979
94.0K
-18.0K
-16.07%
jan 1, 1980
169.0K
+75.0K
79.79%
jan 1, 1981
262.0K
+93.0K
55.03%
jan 1, 1982
334.0K
+72.0K
27.48%
jan 1, 1983
327.0K
-7.0K
-2.1%
jan 1, 1984
569.0K
+242.0K
74.01%
jan 1, 1985
670.0K
+101.0K
17.75%
jan 1, 1986
350.0K
-320.0K
-47.76%
jan 1, 1987
448.0K
+98.0K
28.0%
jan 1, 1988
583.0K
+135.0K
30.13%
jan 1, 1989
93.0K
-490.0K
-84.05%
jan 1, 1990
482.0K
+389.0K
418.28%
jan 1, 1991
275.0K
-207.0K
-42.95%
jan 1, 1992
418.0K
+143.0K
52.0%
jan 1, 1993
413.0K
-5.0K
-1.2%
jan 1, 1994
8.0K
-405.0K
-98.06%
jan 1, 2003
67.0K
+59.0K
737.5%
jan 1, 2008
194.0K
+127.0K
189.55%
jan 1, 2009
283.0K
+89.0K
45.88%
jan 1, 2010
264.0K
-19.0K
-6.71%
jan 1, 2012
373.0K
+109.0K
41.29%
jan 1, 2013
385.0K
+12.0K
3.22%
Ranking of countries by current statistics by years


Comments: