29
/
en
AIzaSyAYiBZKx7MnpbEhh9jyipgxe19OcubqV5w
April 1, 2024
145839
Guinea
GIN
true
2
1
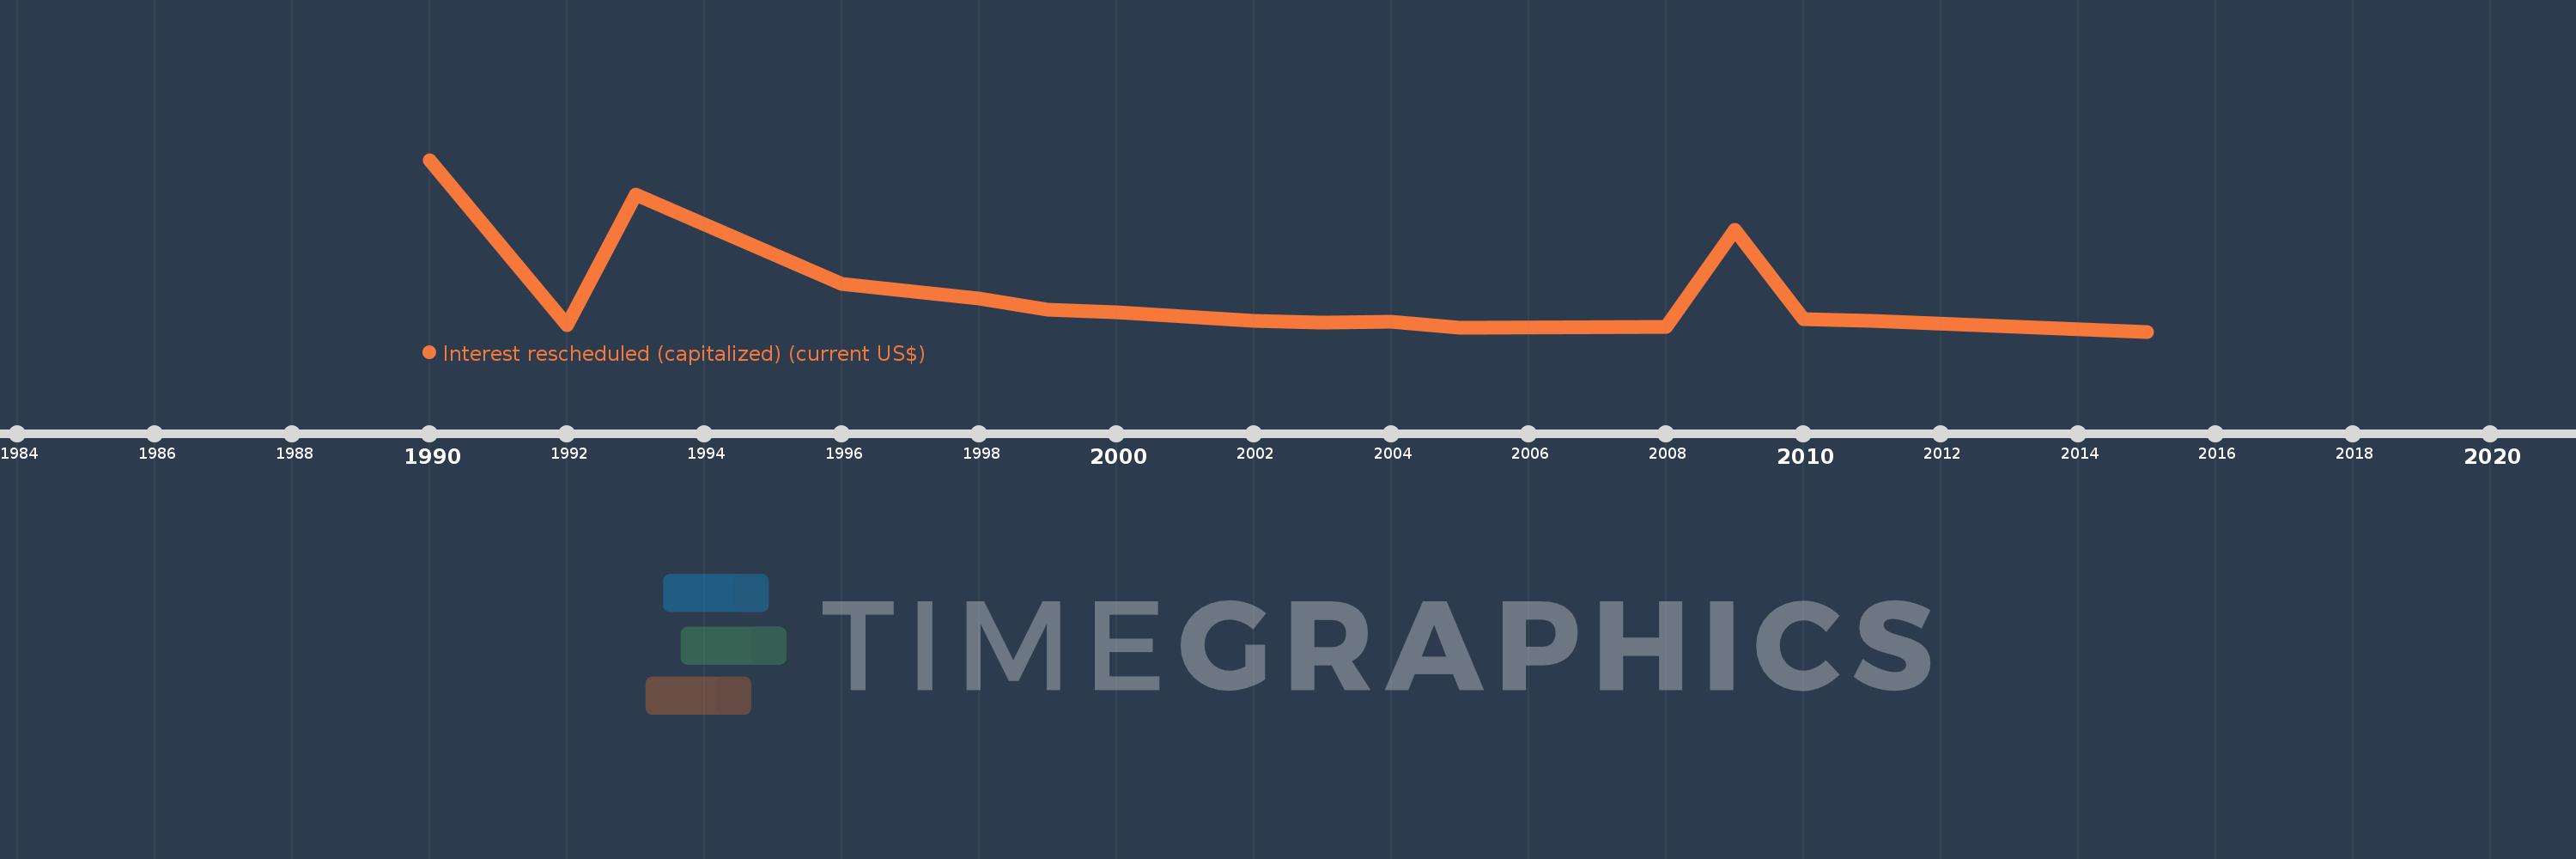
Interest rescheduled (capitalized) (current US$)
2015,2011,2010,2009,2008,2005,2004,2003,2002,2000,1999,1998,1996,1993,1992,1990
This statistics in other country:
Timeline:
This timeline shows a graph from 1990 to 2015 of Guinea. No data until 1989. Number of actual observations by date: 16.
Source name:
World Development Indicators
Source organization:
World Bank, International Debt Statistics.
Categories, topics:
External Debt
Last updated:
apr 23, 2017
Indicators value changes by year
Maximum:
56.555 mln
jan 1, 1990
At the date of observation
Value
Absolute change
Change from previous value
jan 1, 1990
56.555 mln
+56.555 mln
0.0%
jan 1, 1992
2.065 mln
-54.49 mln
-96.35%
jan 1, 1993
45.165 mln
+43.1 mln
2.09K%
jan 1, 1996
15.594 mln
-29.571 mln
-65.47%
jan 1, 1998
11.014 mln
-4.58 mln
-29.37%
jan 1, 1999
7.254 mln
-3.76 mln
-34.14%
jan 1, 2000
6.229 mln
-1.025 mln
-14.13%
jan 1, 2002
3.426 mln
-2.803 mln
-45.0%
jan 1, 2003
2.992 mln
-434.0K
-12.67%
jan 1, 2004
3.153 mln
+161.0K
5.38%
jan 1, 2005
1.147 mln
-2.006 mln
-63.62%
jan 1, 2008
1.534 mln
+387.0K
33.74%
jan 1, 2009
33.622 mln
+32.088 mln
2.09K%
jan 1, 2010
4.018 mln
-29.604 mln
-88.05%
jan 1, 2011
3.665 mln
-353.0K
-8.79%
jan 1, 2015
0.0
-3.665 mln
-100.0%
Ranking of countries by current statistics by years


Comments: