29
/
en
AIzaSyAYiBZKx7MnpbEhh9jyipgxe19OcubqV5w
April 1, 2024
28250
East Asia & Pacific (excluding high income)
EAP
false
2
1
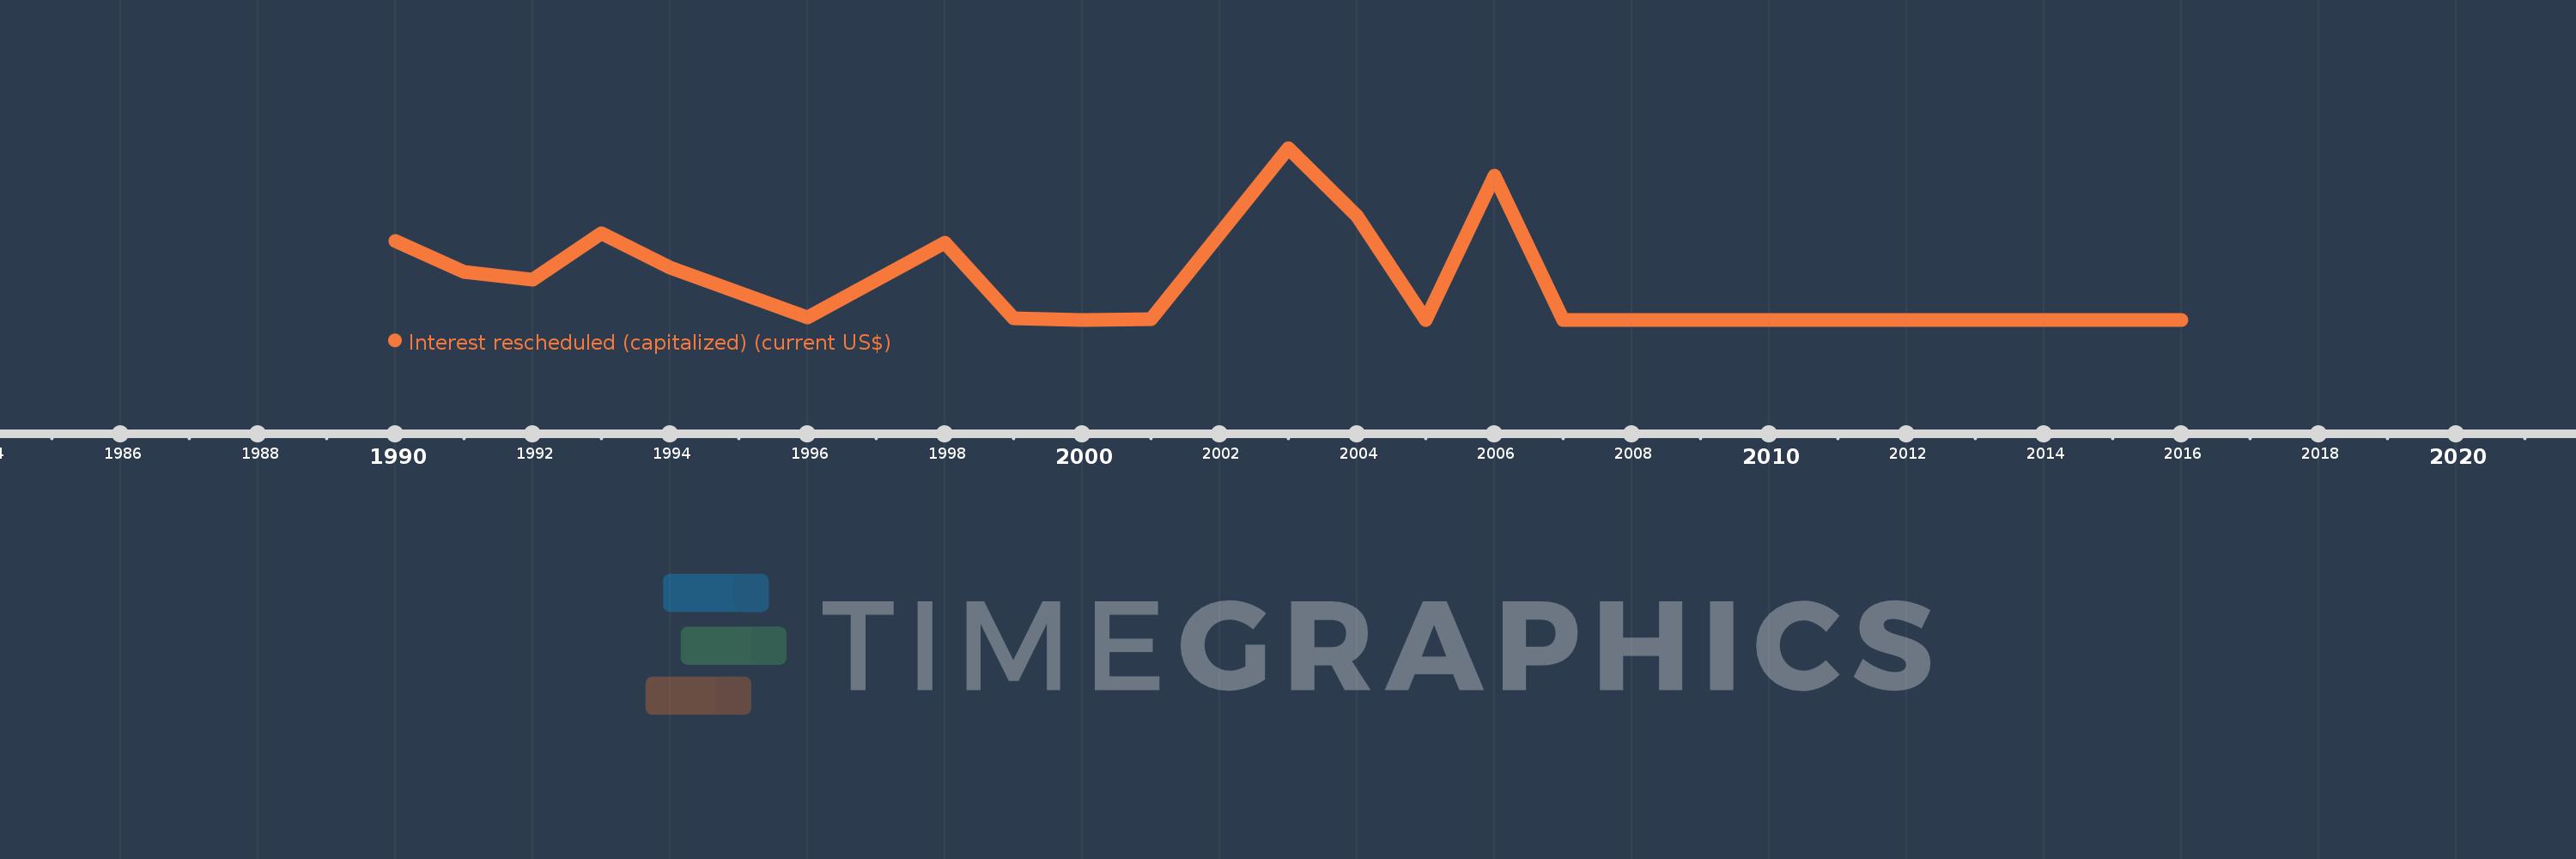
Interest rescheduled (capitalized) (current US$)
2016,2015,2014,2013,2012,2011,2010,2009,2008,2007,2006,2005,2004,2003,2001,2000,1999,1998,1996,1994,1993,1992,1991,1990
This statistics in other country:
Timeline:
This timeline shows a graph from 1990 to 2016 of East Asia & Pacific (excluding high income). No data until 1989. Number of actual observations by date: 24.
Source name:
World Development Indicators
Source organization:
World Bank, International Debt Statistics.
Categories, topics:
External Debt
Last updated:
apr 23, 2017
Indicators value changes by year
Maximum:
674.364 mln
jan 1, 2003
At the date of observation
Value
Absolute change
Change from previous value
jan 1, 1990
310.809 mln
+310.809 mln
0.0%
jan 1, 1991
186.132 mln
-124.677 mln
-40.11%
jan 1, 1992
156.42 mln
-29.712 mln
-15.96%
jan 1, 1993
340.114 mln
+183.694 mln
117.44%
jan 1, 1994
203.922 mln
-136.192 mln
-40.04%
jan 1, 1996
9.313 mln
-194.609 mln
-95.43%
jan 1, 1998
303.326 mln
+294.013 mln
3.16K%
jan 1, 1999
4.803 mln
-298.523 mln
-98.42%
jan 1, 2000
0.0
-4.803 mln
-100.0%
jan 1, 2001
1.404 mln
+1.404 mln
%
jan 1, 2003
674.364 mln
+672.96 mln
47.93K%
jan 1, 2004
407.561 mln
-266.803 mln
-39.56%
jan 1, 2005
0.0
-407.561 mln
-100.0%
jan 1, 2006
565.588 mln
+565.588 mln
%
jan 1, 2007
0.0
-565.588 mln
-100.0%
jan 1, 2010
10.0K
+10.0K
%
jan 1, 2011
81.0K
+71.0K
710.0%
jan 1, 2012
56.0K
-25.0K
-30.86%
jan 1, 2013
7.0K
-49.0K
-87.5%
jan 1, 2014
10.0K
+3.0K
42.86%
jan 1, 2015
0.0
-10.0K
-100.0%
Ranking of countries by current statistics by years


Comments: