29
/
en
AIzaSyAYiBZKx7MnpbEhh9jyipgxe19OcubqV5w
April 1, 2024
272422
Uganda
UGA
true
2
1
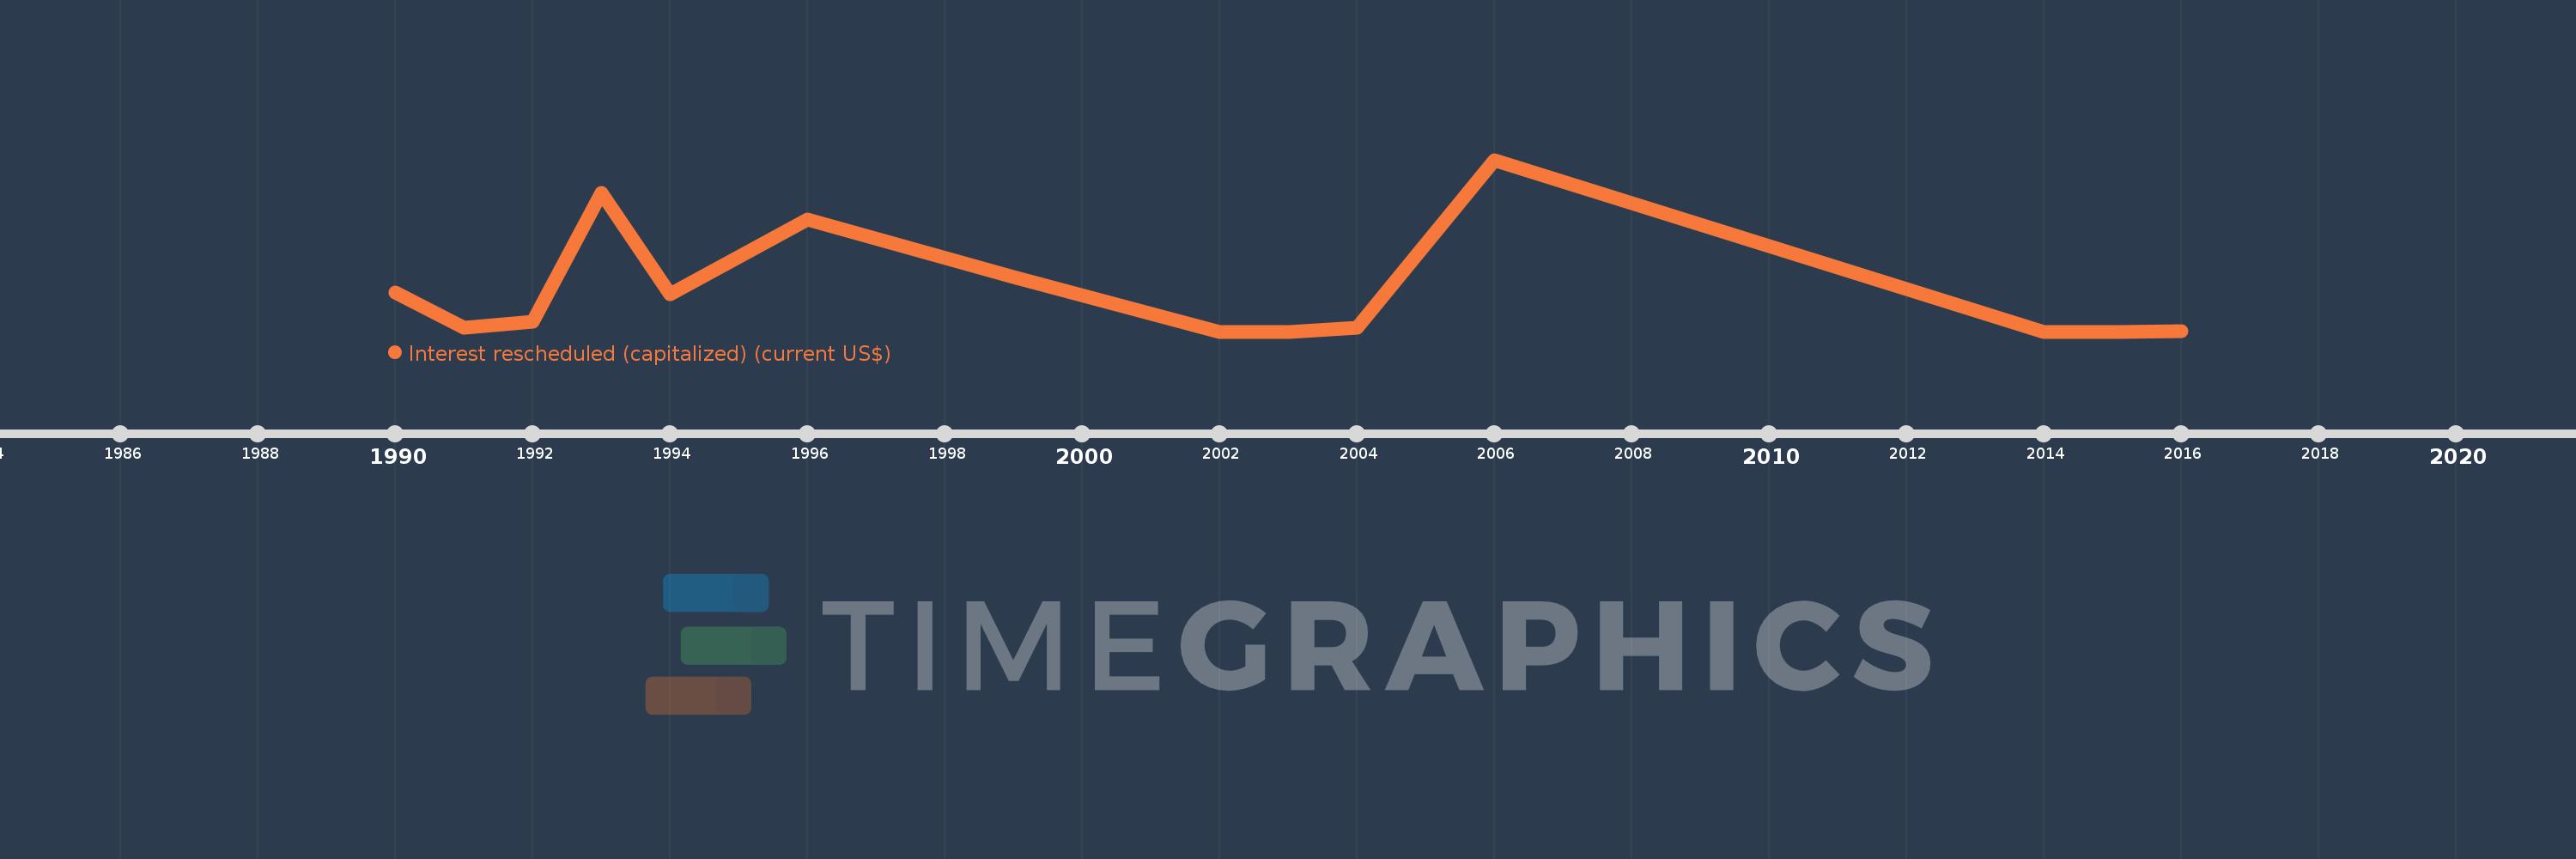
Interest rescheduled (capitalized) (current US$)
2016,2015,2014,2006,2004,2003,2002,1999,1996,1994,1993,1992,1991,1990
This statistics in other country:
Timeline:
This timeline shows a graph from 1990 to 2016 of Uganda. No data until 1989. Number of actual observations by date: 14.
Source name:
World Development Indicators
Source organization:
World Bank, International Debt Statistics.
Categories, topics:
External Debt
Last updated:
apr 23, 2017
Indicators value changes by year
Maximum:
46.522 mln
jan 1, 2006
At the date of observation
Value
Absolute change
Change from previous value
jan 1, 1990
10.628 mln
+10.628 mln
0.0%
jan 1, 1991
1.037 mln
-9.591 mln
-90.24%
jan 1, 1992
2.748 mln
+1.711 mln
165.0%
jan 1, 1993
37.673 mln
+34.925 mln
1.27K%
jan 1, 1994
10.168 mln
-27.505 mln
-73.01%
jan 1, 1996
30.404 mln
+20.236 mln
199.02%
jan 1, 1999
14.759 mln
-15.645 mln
-51.46%
jan 1, 2002
0.0
-14.759 mln
-100.0%
jan 1, 2004
1.006 mln
+1.006 mln
%
jan 1, 2006
46.522 mln
+45.516 mln
4.52K%
jan 1, 2014
0.0
-46.522 mln
-100.0%
jan 1, 2016
132.0K
+132.0K
%
Ranking of countries by current statistics by years


Comments: