30
/
AIzaSyAYiBZKx7MnpbEhh9jyipgxe19OcubqV5w
April 1, 2024
107757
Colombia
COL
true
2
1
PNG, bonds (DOD, current US$)
2016,2015,2014,2013,2012,2011,2010,2009,2008,2007,2006,2005,2004,2003,2002,2001,2000,1999,1998,1997,1996,1995
Public Timelines
FAQ
Menu
Public Timelines
FAQ
Public Timelines
FAQ
For education
For educational institutions
For teachers
For students
Open cabinet
For educational institutions
For teachers
For students
Open cabinet
Create
Close
Create a timeline
Public timelines
Library
FAQ
Download
Global statistics library
→
Colombia
→
PNG, bonds (DOD, current US$)
This statistics in other country:
Argentina
Armenia
Botswana
Brazil
Bulgaria
China
Colombia
Costa Rica
Dominican Republic
East Asia & Pacific (excluding high income)
Ecuador
Egypt, Arab Rep.
El Salvador
Europe & Central Asia (excluding high income)
Georgia
Ghana
Guatemala
IDA only
India
Indonesia
Jamaica
Kazakhstan
Lao PDR
Latin America & Caribbean (excluding high income)
Lebanon
Low & middle income
Lower middle income
Malaysia
Mexico
Middle East & North Africa (excluding high income)
Middle income
Mongolia
Nigeria
Pakistan
Panama
Paraguay
Peru
Philippines
Romania
Russian Federation
Serbia
South Africa
South Asia
Sri Lanka
Sub-Saharan Africa (excluding high income)
Thailand
Turkey
Ukraine
Upper middle income
Venezuela, RB
Vietnam
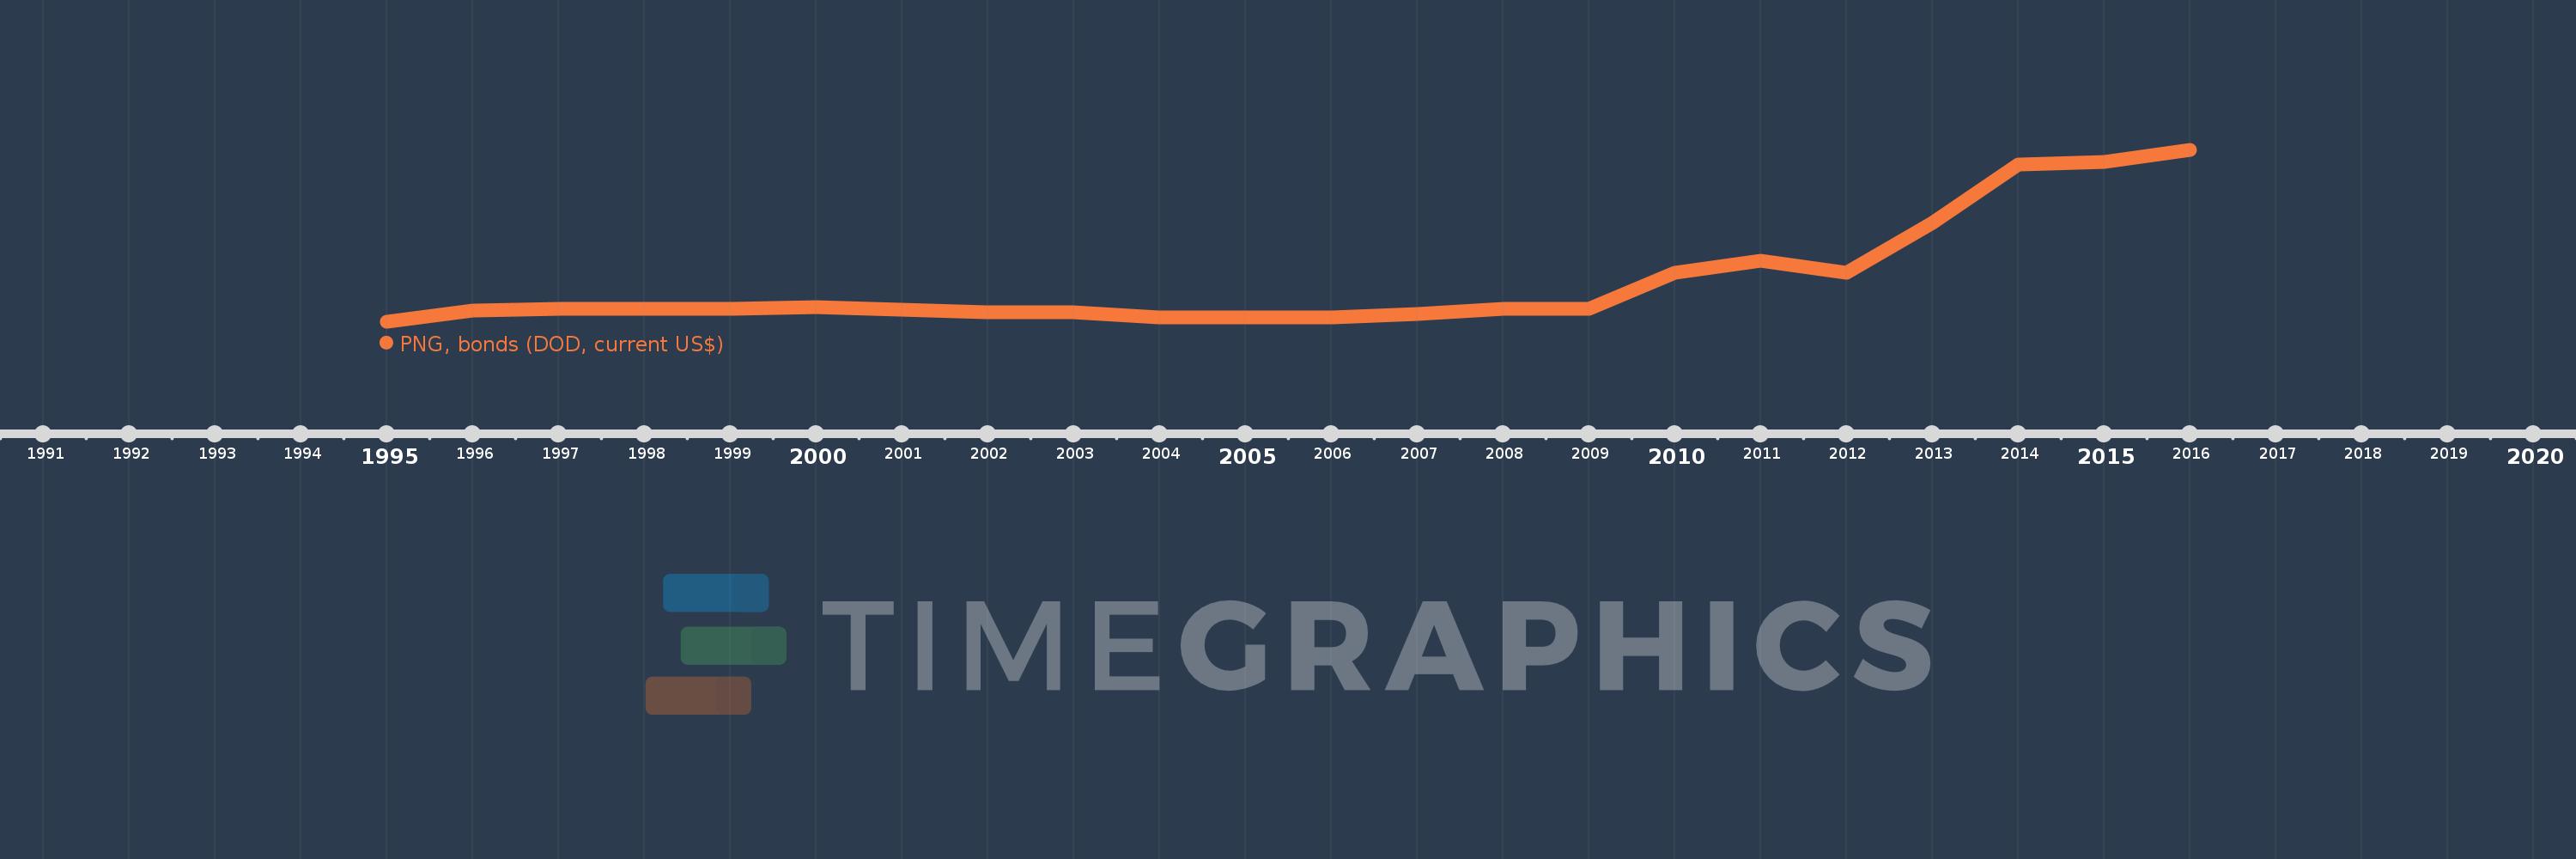
Timeline:
This timeline shows a graph from
1995
to
2016
of Colombia. No data until
1994
. Number of actual observations by date:
22
.
Source name:
World Development Indicators
Source organization:
World Bank, International Debt Statistics.
Categories, topics:
External Debt
Last updated:
apr 23, 2017
Indicators value changes by year
Meaning:
2.262 bln
Minimum:
125.0 mln
jan 1, 1995
Maximum:
9.17 bln
jan 1, 2016
At the date of observation
Value
Absolute change
Change from the previous value
jan 1, 1995
125.0 mln
+125.0 mln
0.0%
jan 1, 1996
716.93 mln
+591.93 mln
473.54%
jan 1, 1997
820.378 mln
+103.448 mln
14.43%
jan 1, 1998
809.273 mln
-11.105 mln
-1.35%
jan 1, 1999
820.736 mln
+11.463 mln
1.42%
jan 1, 2000
884.947 mln
+64.211 mln
7.82%
jan 1, 2001
761.969 mln
-122.978 mln
-13.9%
jan 1, 2002
657.53 mln
-104.439 mln
-13.71%
jan 1, 2003
657.53 mln
0.0
0.0%
jan 1, 2004
375.6 mln
-281.93 mln
-42.88%
jan 1, 2005
370.0 mln
-5.6 mln
-1.49%
jan 1, 2006
370.0 mln
0.0
0.0%
jan 1, 2007
540.0 mln
+170.0 mln
45.95%
jan 1, 2008
809.0 mln
+269.0 mln
49.81%
jan 1, 2009
809.0 mln
0.0
0.0%
jan 1, 2010
2.709 bln
+1.9 bln
234.86%
jan 1, 2011
3.329 bln
+620.0 mln
22.89%
jan 1, 2012
2.72 bln
-609.0 mln
-18.29%
jan 1, 2013
5.32 bln
+2.6 bln
95.59%
jan 1, 2014
8.42 bln
+3.1 bln
58.27%
jan 1, 2015
8.57 bln
+150.0 mln
1.78%
jan 1, 2016
9.17 bln
+600.0 mln
7.0%
Ranking of countries by current statistics by years
About & Feedback
Terms
Privacy
Library
2024
©
Time.Graphics
Support 24/7
Cabinet
Get premium
Donate
The service accepts bank transfer (ACH, Wire) or cards (Visa, MasterCard, etc). Processed by Stripe.
Secured with SSL
Excellent (Trustpilot Reviews)
Based on 115+ reviews
Write your own review on
Trustpilot.com
