29
/
en
AIzaSyAYiBZKx7MnpbEhh9jyipgxe19OcubqV5w
April 1, 2024
166637
Kazakhstan
KAZ
true
2
1
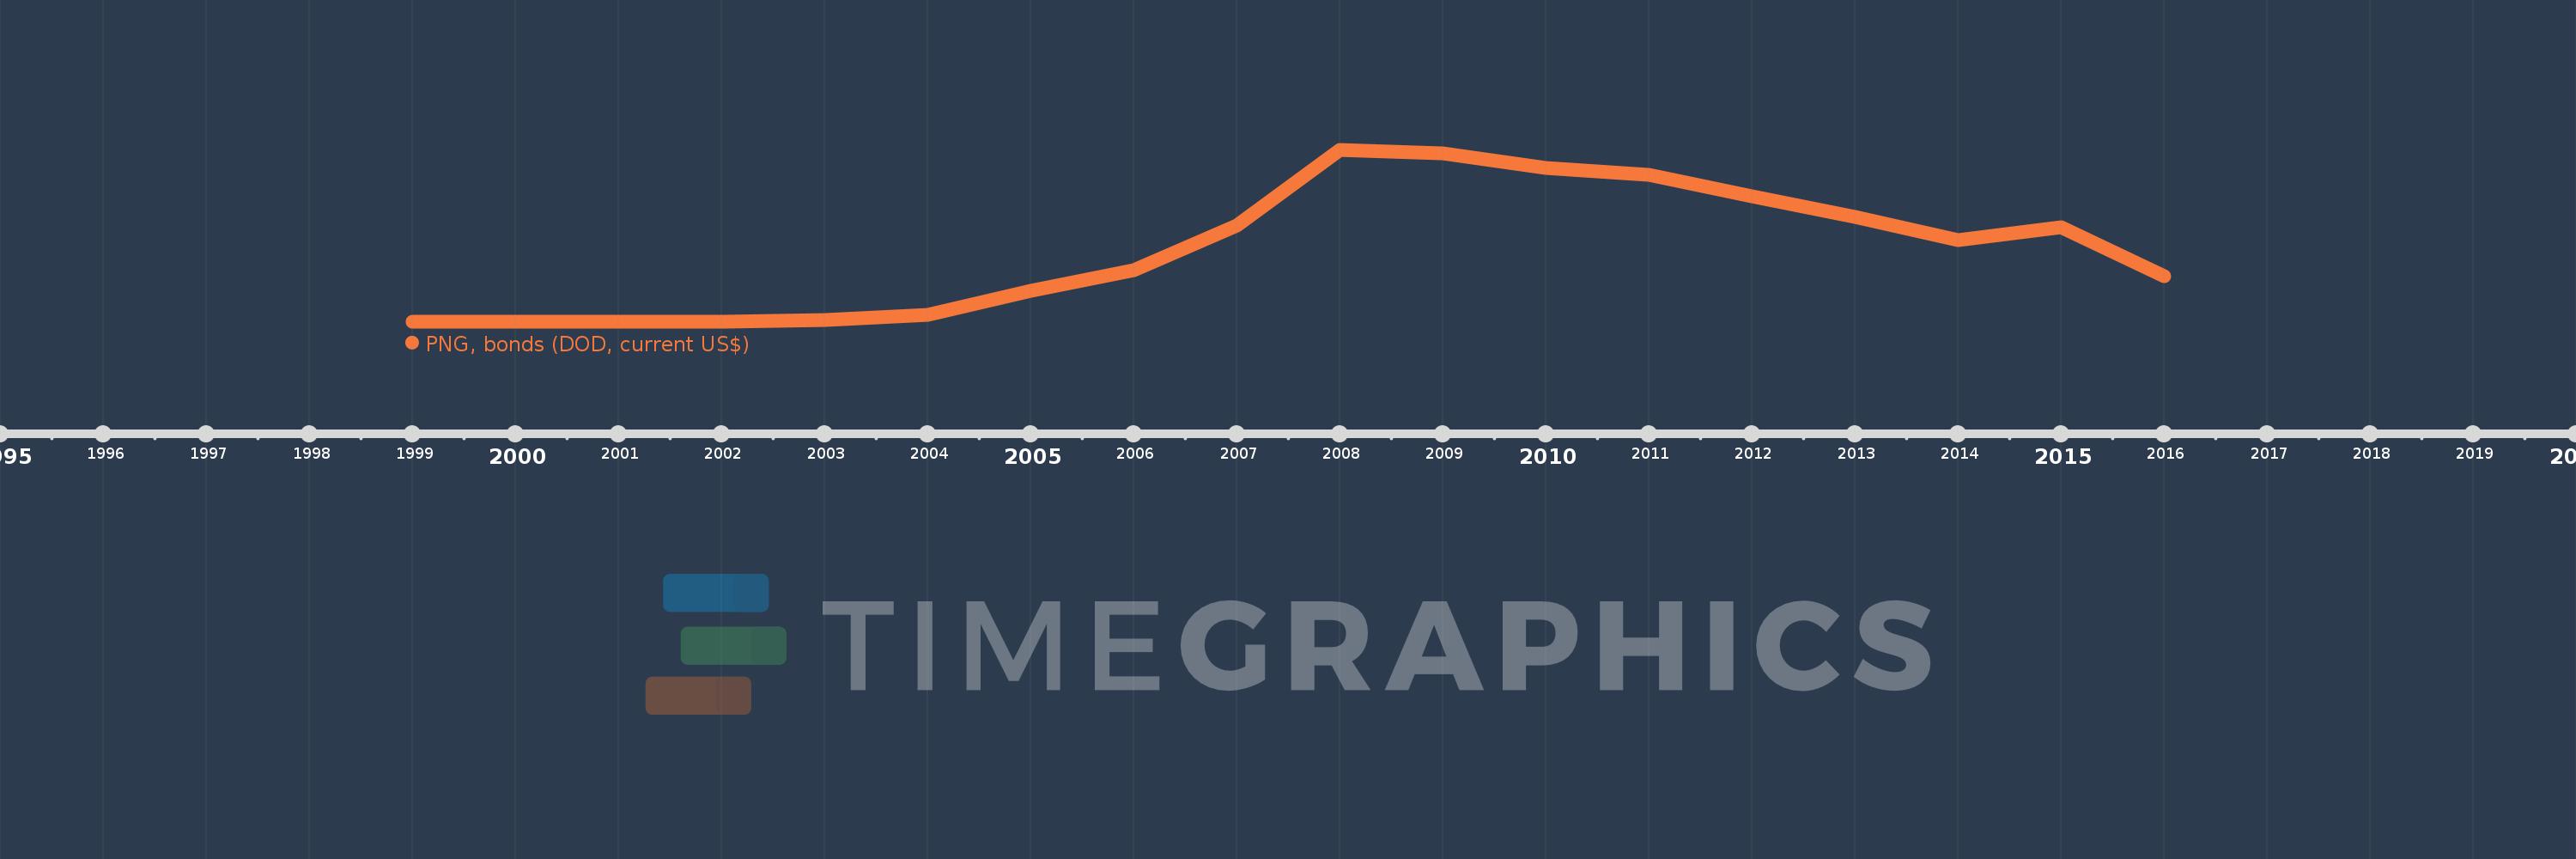
PNG, bonds (DOD, current US$)
2016,2015,2014,2013,2012,2011,2010,2009,2008,2007,2006,2005,2004,2003,2002,2001,2000,1999
This statistics in other country:
Timeline:
This timeline shows a graph from 1999 to 2016 of Kazakhstan. No data until 1998. Number of actual observations by date: 18.
Source name:
World Development Indicators
Source organization:
World Bank, International Debt Statistics.
Categories, topics:
External Debt
Last updated:
apr 23, 2017
Indicators value changes by year
Minimum:
100.0 mln
jan 1, 1999
Maximum:
24.623 bln
jan 1, 2008
At the date of observation
Value
Absolute change
Change from previous value
jan 1, 1999
100.0 mln
+100.0 mln
0.0%
jan 1, 2000
100.0 mln
0.0
0.0%
jan 1, 2001
100.0 mln
0.0
0.0%
jan 1, 2002
100.0 mln
0.0
0.0%
jan 1, 2003
400.0 mln
+300.0 mln
300.0%
jan 1, 2004
1.125 bln
+725.0 mln
181.25%
jan 1, 2005
4.5 bln
+3.375 bln
300.0%
jan 1, 2006
7.55 bln
+3.05 bln
67.78%
jan 1, 2007
13.813 bln
+6.263 bln
82.96%
jan 1, 2008
24.623 bln
+10.81 bln
78.26%
jan 1, 2009
24.125 bln
-497.952 mln
-2.02%
jan 1, 2010
22.097 bln
-2.028 bln
-8.41%
jan 1, 2011
21.044 bln
-1.053 bln
-4.77%
jan 1, 2012
17.995 bln
-3.048 bln
-14.49%
jan 1, 2013
15.098 bln
-2.897 bln
-16.1%
jan 1, 2014
11.79 bln
-3.309 bln
-21.92%
jan 1, 2015
13.682 bln
+1.893 bln
16.05%
jan 1, 2016
6.683 bln
-6.999 bln
-51.16%
Ranking of countries by current statistics by years


Comments: