29
/
en
AIzaSyAYiBZKx7MnpbEhh9jyipgxe19OcubqV5w
April 1, 2024
216926
Pakistan
PAK
true
2
1
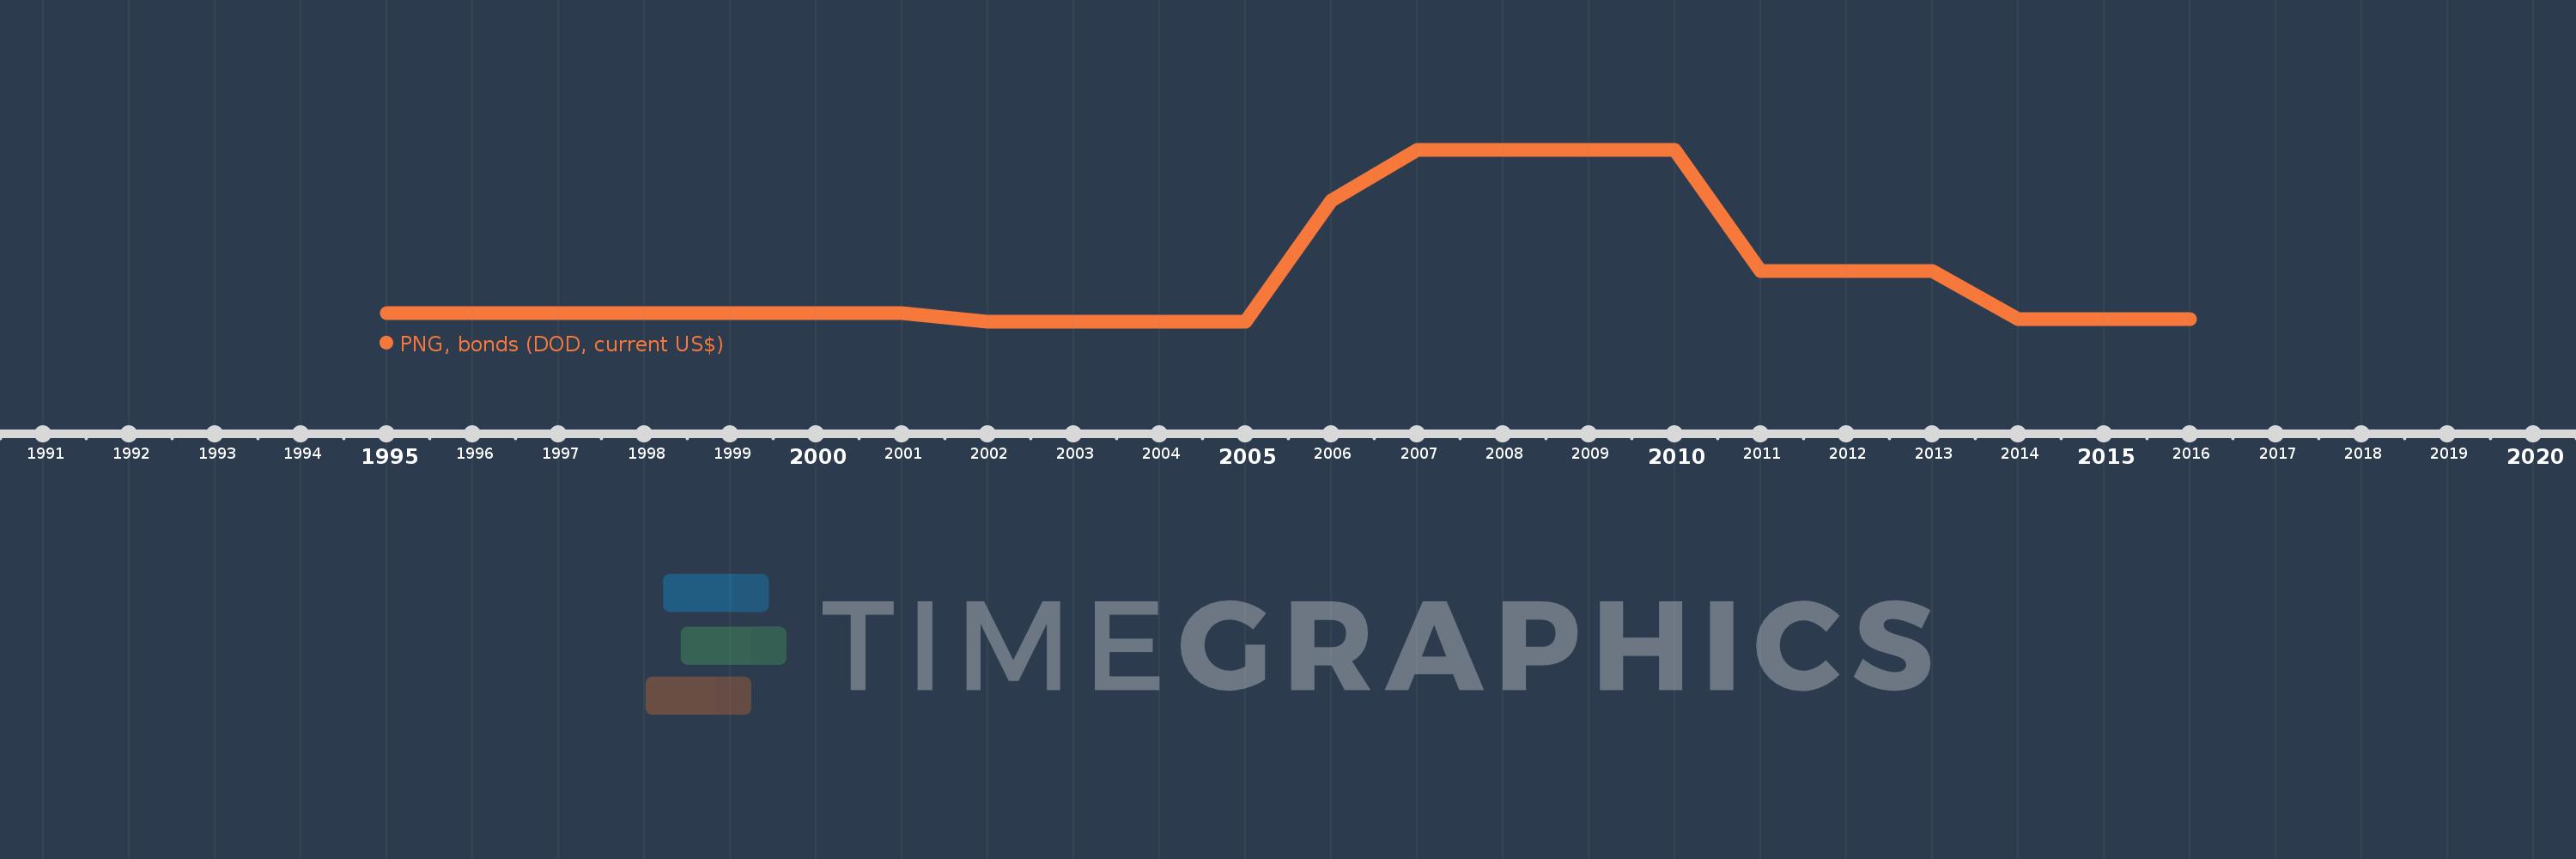
PNG, bonds (DOD, current US$)
2016,2015,2014,2013,2012,2011,2010,2009,2008,2007,2006,2005,2004,2003,2002,2001,2000,1999,1998,1997,1996,1995
This statistics in other country:
Timeline:
This timeline shows a graph from 1995 to 2016 of Pakistan. No data until 1994. Number of actual observations by date: 22.
Source name:
World Development Indicators
Source organization:
World Bank, International Debt Statistics.
Categories, topics:
External Debt
Last updated:
apr 23, 2017
Indicators value changes by year
Maximum:
850.0 mln
jan 1, 2007
At the date of observation
Value
Absolute change
Change from previous value
jan 1, 1995
45.0 mln
+45.0 mln
0.0%
jan 1, 1996
45.0 mln
0.0
0.0%
jan 1, 1997
45.0 mln
0.0
0.0%
jan 1, 1998
45.0 mln
0.0
0.0%
jan 1, 1999
45.0 mln
0.0
0.0%
jan 1, 2000
45.0 mln
0.0
0.0%
jan 1, 2001
45.0 mln
0.0
0.0%
jan 1, 2002
0.0
-45.0 mln
-100.0%
jan 1, 2006
600.0 mln
+600.0 mln
%
jan 1, 2007
850.0 mln
+250.0 mln
41.67%
jan 1, 2008
850.0 mln
0.0
0.0%
jan 1, 2009
850.0 mln
0.0
0.0%
jan 1, 2010
850.0 mln
0.0
0.0%
jan 1, 2011
250.0 mln
-600.0 mln
-70.59%
jan 1, 2012
250.0 mln
0.0
0.0%
jan 1, 2013
250.0 mln
0.0
0.0%
jan 1, 2014
12.0 mln
-238.0 mln
-95.2%
jan 1, 2015
12.0 mln
0.0
0.0%
jan 1, 2016
12.0 mln
0.0
0.0%
Ranking of countries by current statistics by years


Comments: