29
/
en
AIzaSyAYiBZKx7MnpbEhh9jyipgxe19OcubqV5w
April 1, 2024
106318
China
CHN
true
2
1
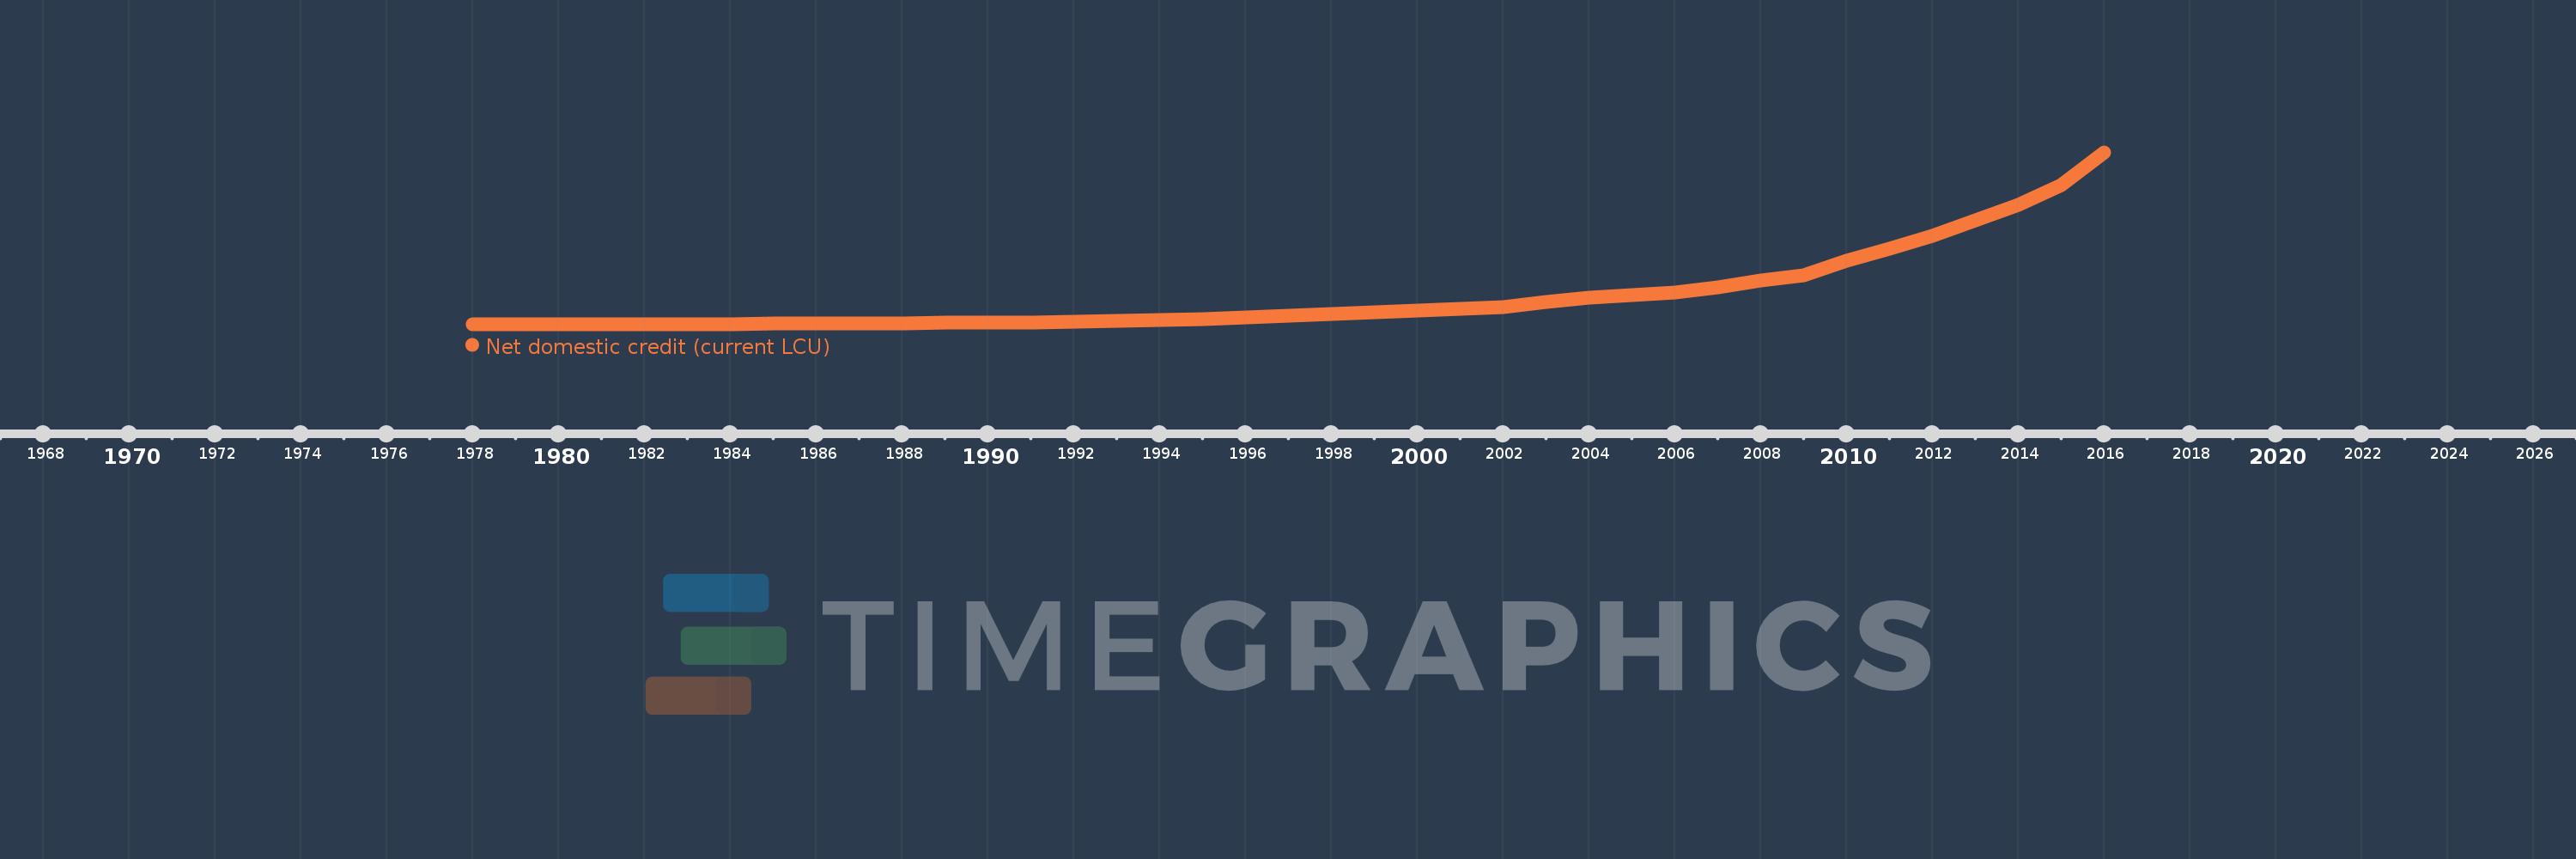
Net domestic credit (current LCU)
2016,2015,2014,2013,2012,2011,2010,2009,2008,2007,2006,2005,2004,2003,2002,2001,2000,1999,1998,1997,1996,1995,1994,1993,1992,1991,1990,1989,1988,1987,1986,1985,1984,1983,1982,1981,1980,1979,1978
This statistics in other country:
AfghanistanAlbaniaAlgeriaAngolaAntigua and BarbudaArgentinaArmeniaArubaAustraliaAustriaAzerbaijanBahamas, TheBahrainBangladeshBarbadosBelarusBelgiumBelizeBeninBhutanBoliviaBosnia and HerzegovinaBotswanaBrazilBrunei DarussalamBulgariaBurkina FasoBurundiCabo VerdeCambodiaCameroonCanadaCentral African RepublicChadChileChinaColombiaComorosCongo, Dem. Rep.Congo, Rep.Costa RicaCote d'IvoireCroatiaCyprusCzech RepublicDenmarkDjiboutiDominicaDominican RepublicEcuadorEgypt, Arab Rep.El SalvadorEquatorial GuineaEritreaEstoniaEthiopiaEuro areaFijiFinlandFranceGabonGambia, TheGeorgiaGermanyGhanaGreeceGrenadaGuatemalaGuineaGuinea-BissauGuyanaHaitiHondurasHong Kong SAR, ChinaHungaryIcelandIndiaIndonesiaIran, Islamic Rep.IraqIrelandIsraelItalyJamaicaJapanJordanKazakhstanKenyaKorea, Rep.KosovoKuwaitKyrgyz RepublicLao PDRLatviaLebanonLesothoLiberiaLibyaLithuaniaLuxembourgMacao SAR, ChinaMacedonia, FYRMadagascarMalawiMalaysiaMaldivesMaliMaltaMauritaniaMauritiusMexicoMicronesia, Fed. Sts.MoldovaMongoliaMontenegroMoroccoMozambiqueMyanmarNamibiaNepalNetherlandsNew ZealandNicaraguaNigerNigeriaNorwayOmanPakistanPanamaPapua New GuineaParaguayPeruPhilippinesPolandPortugalQatarRomaniaRussian FederationRwandaSamoaSao Tome and PrincipeSaudi ArabiaSenegalSerbiaSeychellesSierra LeoneSingaporeSlovak RepublicSloveniaSolomon IslandsSouth AfricaSouth SudanSpainSri LankaSt. Kitts and NevisSt. LuciaSt. Vincent and the GrenadinesSudanSurinameSwazilandSwedenSwitzerlandSyrian Arab RepublicTajikistanTanzaniaThailandTimor-LesteTogoTongaTrinidad and TobagoTunisiaTurkeyUgandaUkraineUnited Arab EmiratesUnited KingdomUnited StatesUruguayVanuatuVenezuela, RBVietnamWest Bank and GazaYemen, Rep.ZambiaZimbabwe Timeline:
This timeline shows a graph from 1978 to 2016 of China. No data until 1977. Number of actual observations by date: 39.
Source name:
World Development Indicators
Source organization:
International Monetary Fund, International Financial Statistics and data files.
Categories, topics:
Financial Sector
Last updated:
apr 23, 2017
Indicators value changes by year
Minimum:
126.24 bln
jan 1, 1978
Maximum:
133.269 trl
jan 1, 2016
At the date of observation
Value
Absolute change
Change from previous value
jan 1, 1978
126.24 bln
+126.24 bln
0.0%
jan 1, 1979
139.31 bln
+13.07 bln
10.35%
jan 1, 1980
198.11 bln
+58.8 bln
42.21%
jan 1, 1981
242.25 bln
+44.14 bln
22.28%
jan 1, 1982
273.99 bln
+31.74 bln
13.1%
jan 1, 1983
304.67 bln
+30.68 bln
11.2%
jan 1, 1984
343.7 bln
+39.03 bln
12.81%
jan 1, 1985
451.45 bln
+107.75 bln
31.35%
jan 1, 1986
592.95 bln
+141.5 bln
31.34%
jan 1, 1987
794.18 bln
+201.23 bln
33.94%
jan 1, 1988
970.87 bln
+176.69 bln
22.25%
jan 1, 1989
1.154 trl
+182.77 bln
18.83%
jan 1, 1990
1.35 trl
+196.15 bln
17.0%
jan 1, 1991
1.669 trl
+319.13 bln
23.64%
jan 1, 1992
2.003 trl
+333.75 bln
20.0%
jan 1, 1993
2.45 trl
+447.25 bln
22.33%
jan 1, 1994
3.575 trl
+1.125 trl
45.93%
jan 1, 1995
4.31 trl
+735.16 bln
20.56%
jan 1, 1996
5.332 trl
+1.021 trl
23.7%
jan 1, 1997
6.642 trl
+1.31 trl
24.58%
jan 1, 1998
7.954 trl
+1.312 trl
19.76%
jan 1, 1999
9.547 trl
+1.593 trl
20.02%
jan 1, 2000
10.701 trl
+1.154 trl
12.09%
jan 1, 2001
11.873 trl
+1.172 trl
10.95%
jan 1, 2002
13.488 trl
+1.614 trl
13.6%
jan 1, 2003
17.262 trl
+3.775 trl
27.99%
jan 1, 2004
20.628 trl
+3.366 trl
19.5%
jan 1, 2005
22.442 trl
+1.814 trl
8.79%
jan 1, 2006
24.837 trl
+2.395 trl
10.67%
jan 1, 2007
28.874 trl
+4.037 trl
16.25%
jan 1, 2008
33.966 trl
+5.092 trl
17.64%
jan 1, 2009
37.938 trl
+3.972 trl
11.69%
jan 1, 2010
49.458 trl
+11.52 trl
30.37%
jan 1, 2011
58.732 trl
+9.274 trl
18.75%
jan 1, 2012
68.797 trl
+10.065 trl
17.14%
jan 1, 2013
80.559 trl
+11.762 trl
17.1%
jan 1, 2014
92.701 trl
+12.141 trl
15.07%
jan 1, 2015
107.696 trl
+14.996 trl
16.18%
jan 1, 2016
133.269 trl
+25.573 trl
23.75%
Ranking of countries by current statistics by years


Comments: