29
/
en
AIzaSyAYiBZKx7MnpbEhh9jyipgxe19OcubqV5w
April 1, 2024
197921
Moldova
MDA
true
2
1
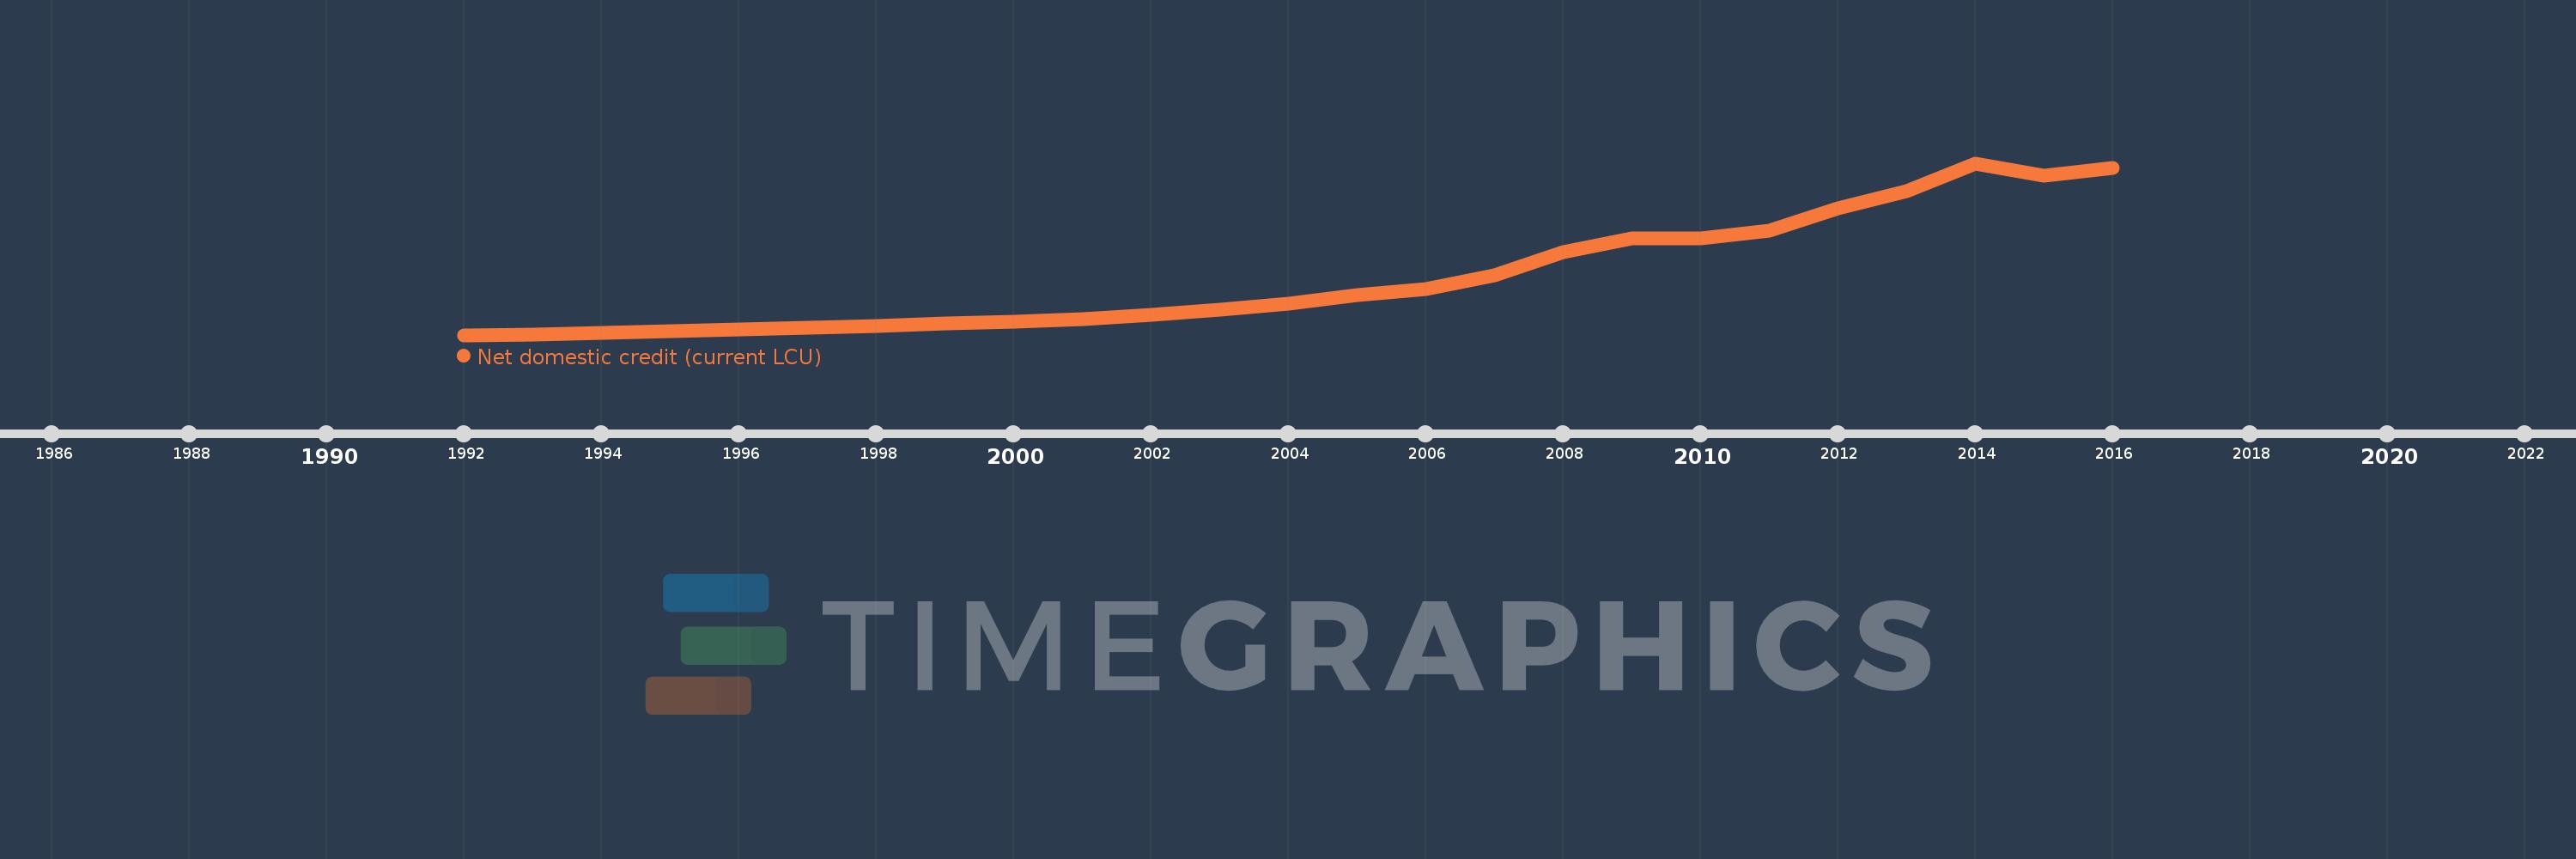
Net domestic credit (current LCU)
2016,2015,2014,2013,2012,2011,2010,2009,2008,2007,2006,2005,2004,2003,2002,2001,2000,1999,1998,1997,1996,1995,1994,1993,1992
This statistics in other country:
AfghanistanAlbaniaAlgeriaAngolaAntigua and BarbudaArgentinaArmeniaArubaAustraliaAustriaAzerbaijanBahamas, TheBahrainBangladeshBarbadosBelarusBelgiumBelizeBeninBhutanBoliviaBosnia and HerzegovinaBotswanaBrazilBrunei DarussalamBulgariaBurkina FasoBurundiCabo VerdeCambodiaCameroonCanadaCentral African RepublicChadChileChinaColombiaComorosCongo, Dem. Rep.Congo, Rep.Costa RicaCote d'IvoireCroatiaCyprusCzech RepublicDenmarkDjiboutiDominicaDominican RepublicEcuadorEgypt, Arab Rep.El SalvadorEquatorial GuineaEritreaEstoniaEthiopiaEuro areaFijiFinlandFranceGabonGambia, TheGeorgiaGermanyGhanaGreeceGrenadaGuatemalaGuineaGuinea-BissauGuyanaHaitiHondurasHong Kong SAR, ChinaHungaryIcelandIndiaIndonesiaIran, Islamic Rep.IraqIrelandIsraelItalyJamaicaJapanJordanKazakhstanKenyaKorea, Rep.KosovoKuwaitKyrgyz RepublicLao PDRLatviaLebanonLesothoLiberiaLibyaLithuaniaLuxembourgMacao SAR, ChinaMacedonia, FYRMadagascarMalawiMalaysiaMaldivesMaliMaltaMauritaniaMauritiusMexicoMicronesia, Fed. Sts.MoldovaMongoliaMontenegroMoroccoMozambiqueMyanmarNamibiaNepalNetherlandsNew ZealandNicaraguaNigerNigeriaNorwayOmanPakistanPanamaPapua New GuineaParaguayPeruPhilippinesPolandPortugalQatarRomaniaRussian FederationRwandaSamoaSao Tome and PrincipeSaudi ArabiaSenegalSerbiaSeychellesSierra LeoneSingaporeSlovak RepublicSloveniaSolomon IslandsSouth AfricaSouth SudanSpainSri LankaSt. Kitts and NevisSt. LuciaSt. Vincent and the GrenadinesSudanSurinameSwazilandSwedenSwitzerlandSyrian Arab RepublicTajikistanTanzaniaThailandTimor-LesteTogoTongaTrinidad and TobagoTunisiaTurkeyUgandaUkraineUnited Arab EmiratesUnited KingdomUnited StatesUruguayVanuatuVenezuela, RBVietnamWest Bank and GazaYemen, Rep.ZambiaZimbabwe Timeline:
This timeline shows a graph from 1992 to 2016 of Moldova. No data until 1991. Number of actual observations by date: 25.
Source name:
World Development Indicators
Source organization:
International Monetary Fund, International Financial Statistics and data files.
Categories, topics:
Financial Sector
Last updated:
apr 23, 2017
Indicators value changes by year
Minimum:
16.273 mln
jan 1, 1992
Maximum:
44.397 bln
jan 1, 2014
At the date of observation
Value
Absolute change
Change from previous value
jan 1, 1992
16.273 mln
+16.273 mln
0.0%
jan 1, 1993
107.389 mln
+91.116 mln
559.92%
jan 1, 1994
463.122 mln
+355.733 mln
331.26%
jan 1, 1995
933.099 mln
+469.978 mln
101.48%
jan 1, 1996
1.536 bln
+603.304 mln
64.66%
jan 1, 1997
1.825 bln
+288.399 mln
18.77%
jan 1, 1998
2.314 bln
+489.541 mln
26.83%
jan 1, 1999
2.991 bln
+676.797 mln
29.24%
jan 1, 2000
3.533 bln
+541.481 mln
18.1%
jan 1, 2001
4.04 bln
+507.348 mln
14.36%
jan 1, 2002
5.236 bln
+1.196 bln
29.59%
jan 1, 2003
6.557 bln
+1.321 bln
25.23%
jan 1, 2004
8.148 bln
+1.591 bln
24.27%
jan 1, 2005
10.252 bln
+2.104 bln
25.82%
jan 1, 2006
11.869 bln
+1.617 bln
15.77%
jan 1, 2007
15.444 bln
+3.576 bln
30.13%
jan 1, 2008
21.463 bln
+6.018 bln
38.97%
jan 1, 2009
25.018 bln
+3.555 bln
16.56%
jan 1, 2010
25.006 bln
-11.894 mln
-0.05%
jan 1, 2011
26.881 bln
+1.875 bln
7.5%
jan 1, 2012
32.644 bln
+5.763 bln
21.44%
jan 1, 2013
37.29 bln
+4.646 bln
14.23%
jan 1, 2014
44.397 bln
+7.107 bln
19.06%
jan 1, 2015
41.273 bln
-3.123 bln
-7.04%
jan 1, 2016
43.073 bln
+1.799 bln
4.36%
Ranking of countries by current statistics by years


Comments: