29
/
en
AIzaSyAYiBZKx7MnpbEhh9jyipgxe19OcubqV5w
April 1, 2024
225182
Poland
POL
true
2
1
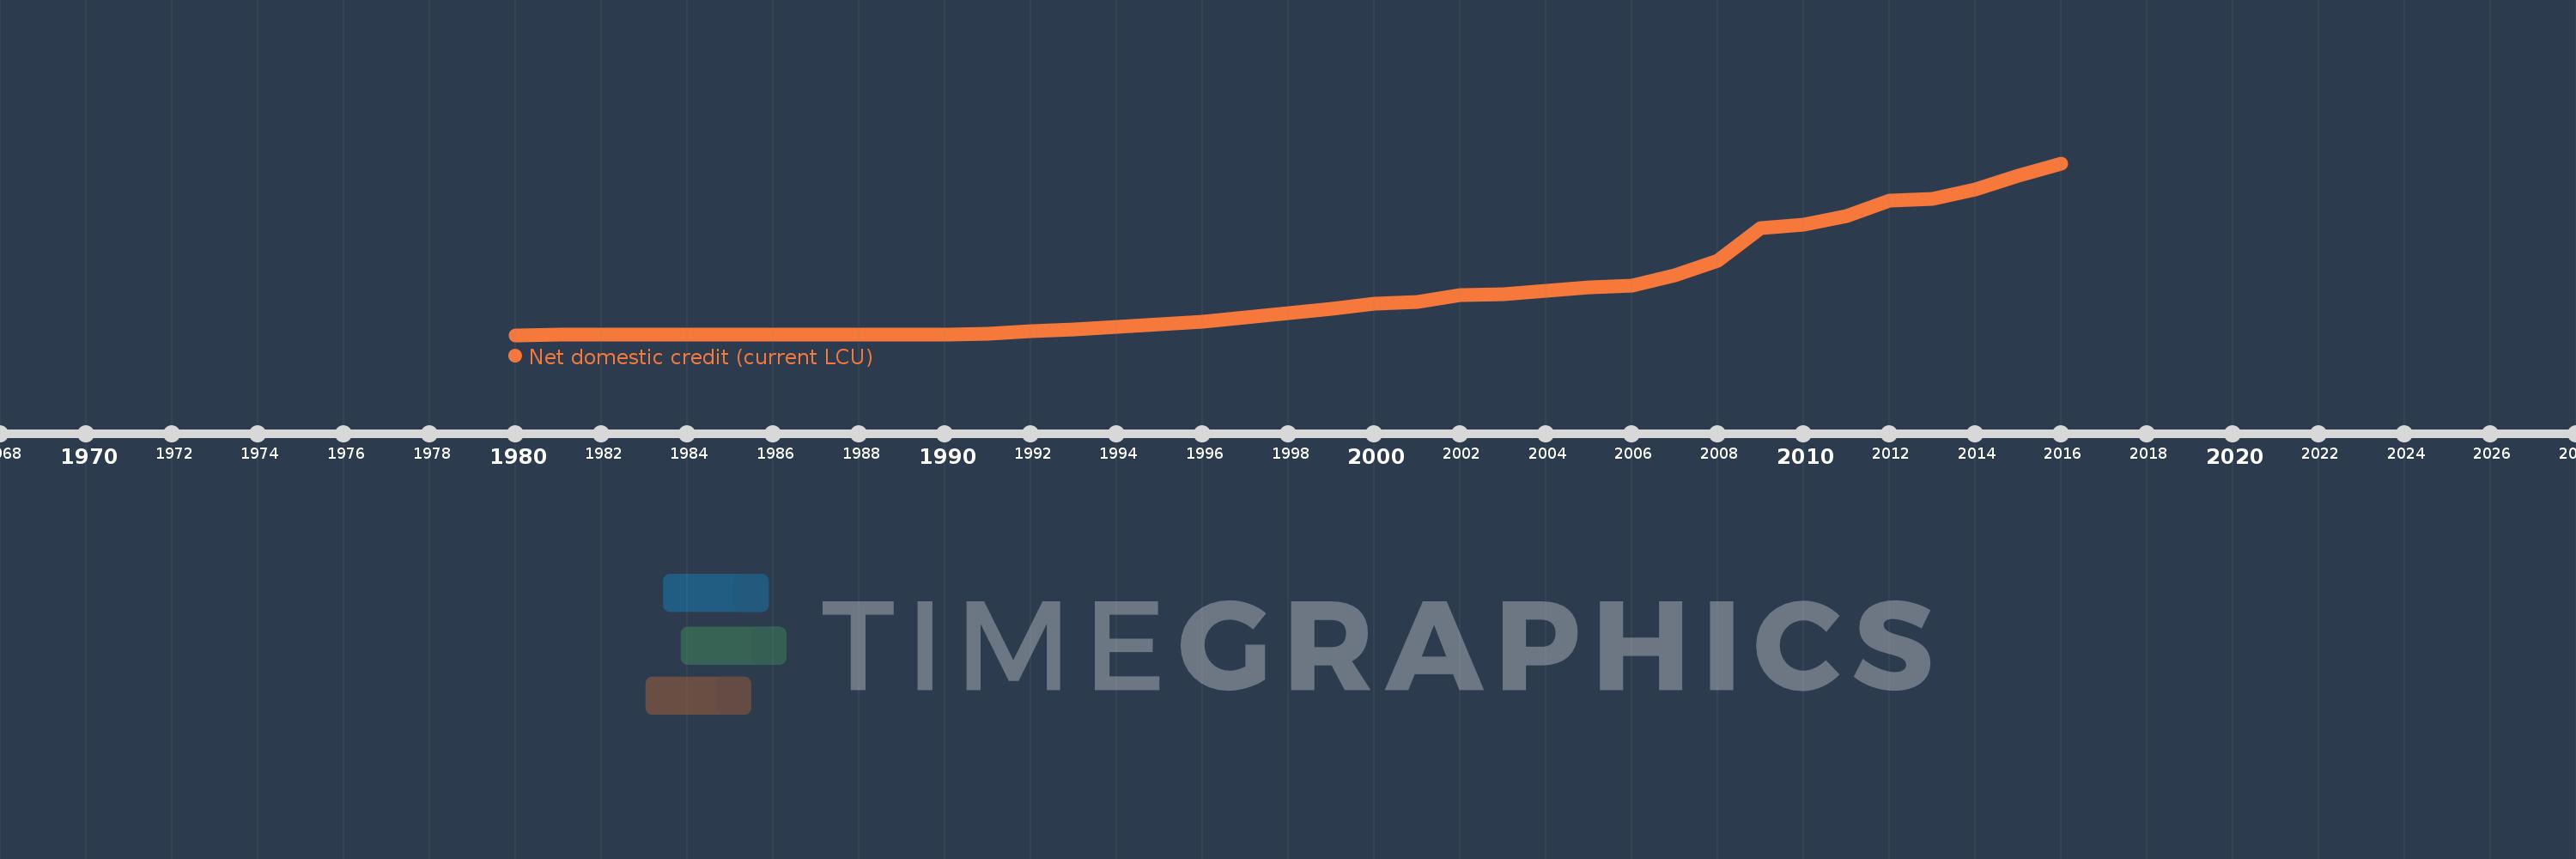
Net domestic credit (current LCU)
2016,2015,2014,2013,2012,2011,2010,2009,2008,2007,2006,2005,2004,2003,2002,2001,2000,1999,1998,1997,1996,1995,1994,1993,1992,1991,1990,1989,1988,1987,1986,1985,1984,1983,1982,1981,1980
This statistics in other country:
AfghanistanAlbaniaAlgeriaAngolaAntigua and BarbudaArgentinaArmeniaArubaAustraliaAustriaAzerbaijanBahamas, TheBahrainBangladeshBarbadosBelarusBelgiumBelizeBeninBhutanBoliviaBosnia and HerzegovinaBotswanaBrazilBrunei DarussalamBulgariaBurkina FasoBurundiCabo VerdeCambodiaCameroonCanadaCentral African RepublicChadChileChinaColombiaComorosCongo, Dem. Rep.Congo, Rep.Costa RicaCote d'IvoireCroatiaCyprusCzech RepublicDenmarkDjiboutiDominicaDominican RepublicEcuadorEgypt, Arab Rep.El SalvadorEquatorial GuineaEritreaEstoniaEthiopiaEuro areaFijiFinlandFranceGabonGambia, TheGeorgiaGermanyGhanaGreeceGrenadaGuatemalaGuineaGuinea-BissauGuyanaHaitiHondurasHong Kong SAR, ChinaHungaryIcelandIndiaIndonesiaIran, Islamic Rep.IraqIrelandIsraelItalyJamaicaJapanJordanKazakhstanKenyaKorea, Rep.KosovoKuwaitKyrgyz RepublicLao PDRLatviaLebanonLesothoLiberiaLibyaLithuaniaLuxembourgMacao SAR, ChinaMacedonia, FYRMadagascarMalawiMalaysiaMaldivesMaliMaltaMauritaniaMauritiusMexicoMicronesia, Fed. Sts.MoldovaMongoliaMontenegroMoroccoMozambiqueMyanmarNamibiaNepalNetherlandsNew ZealandNicaraguaNigerNigeriaNorwayOmanPakistanPanamaPapua New GuineaParaguayPeruPhilippinesPolandPortugalQatarRomaniaRussian FederationRwandaSamoaSao Tome and PrincipeSaudi ArabiaSenegalSerbiaSeychellesSierra LeoneSingaporeSlovak RepublicSloveniaSolomon IslandsSouth AfricaSouth SudanSpainSri LankaSt. Kitts and NevisSt. LuciaSt. Vincent and the GrenadinesSudanSurinameSwazilandSwedenSwitzerlandSyrian Arab RepublicTajikistanTanzaniaThailandTimor-LesteTogoTongaTrinidad and TobagoTunisiaTurkeyUgandaUkraineUnited Arab EmiratesUnited KingdomUnited StatesUruguayVanuatuVenezuela, RBVietnamWest Bank and GazaYemen, Rep.ZambiaZimbabwe Timeline:
This timeline shows a graph from 1980 to 2016 of Poland. No data until 1979. Number of actual observations by date: 37.
Source name:
World Development Indicators
Source organization:
International Monetary Fund, International Financial Statistics and data files.
Categories, topics:
Financial Sector
Last updated:
apr 23, 2017
Indicators value changes by year
Minimum:
232.0 mln
jan 1, 1980
Maximum:
1.316 trl
jan 1, 2016
At the date of observation
Value
Absolute change
Change from previous value
jan 1, 1980
232.0 mln
+232.0 mln
0.0%
jan 1, 1981
276.0 mln
+44.0 mln
18.97%
jan 1, 1982
342.39 mln
+66.39 mln
24.05%
jan 1, 1983
412.71 mln
+70.32 mln
20.54%
jan 1, 1984
465.2 mln
+52.49 mln
12.72%
jan 1, 1985
510.48 mln
+45.28 mln
9.73%
jan 1, 1986
607.03 mln
+96.55 mln
18.91%
jan 1, 1987
711.64 mln
+104.61 mln
17.23%
jan 1, 1988
841.05 mln
+129.41 mln
18.18%
jan 1, 1989
1.235 bln
+393.76 mln
46.82%
jan 1, 1990
3.922 bln
+2.687 bln
217.61%
jan 1, 1991
11.541 bln
+7.619 bln
194.27%
jan 1, 1992
29.066 bln
+17.525 bln
151.85%
jan 1, 1993
44.762 bln
+15.697 bln
54.0%
jan 1, 1994
64.478 bln
+19.716 bln
44.05%
jan 1, 1995
83.906 bln
+19.428 bln
30.13%
jan 1, 1996
101.378 bln
+17.472 bln
20.82%
jan 1, 1997
133.069 bln
+31.691 bln
31.26%
jan 1, 1998
167.213 bln
+34.144 bln
25.66%
jan 1, 1999
202.559 bln
+35.346 bln
21.14%
jan 1, 2000
241.975 bln
+39.416 bln
19.46%
jan 1, 2001
256.323 bln
+14.348 bln
5.93%
jan 1, 2002
303.531 bln
+47.208 bln
18.42%
jan 1, 2003
315.125 bln
+11.593 bln
3.82%
jan 1, 2004
340.003 bln
+24.879 bln
7.89%
jan 1, 2005
363.701 bln
+23.698 bln
6.97%
jan 1, 2006
380.575 bln
+16.874 bln
4.64%
jan 1, 2007
458.493 bln
+77.918 bln
20.47%
jan 1, 2008
567.708 bln
+109.215 bln
23.82%
jan 1, 2009
816.785 bln
+249.077 bln
43.87%
jan 1, 2010
845.054 bln
+28.269 bln
3.46%
jan 1, 2011
913.862 bln
+68.808 bln
8.14%
jan 1, 2012
1.033 trl
+118.883 bln
13.01%
jan 1, 2013
1.044 trl
+11.177 bln
1.08%
jan 1, 2014
1.114 trl
+69.937 bln
6.7%
jan 1, 2015
1.22 trl
+106.525 bln
9.56%
jan 1, 2016
1.316 trl
+95.896 bln
7.86%
Ranking of countries by current statistics by years


Comments: