29
/pt/
pt
AIzaSyAYiBZKx7MnpbEhh9jyipgxe19OcubqV5w
April 1, 2024
96597
Burundi
BDI
true
2
1
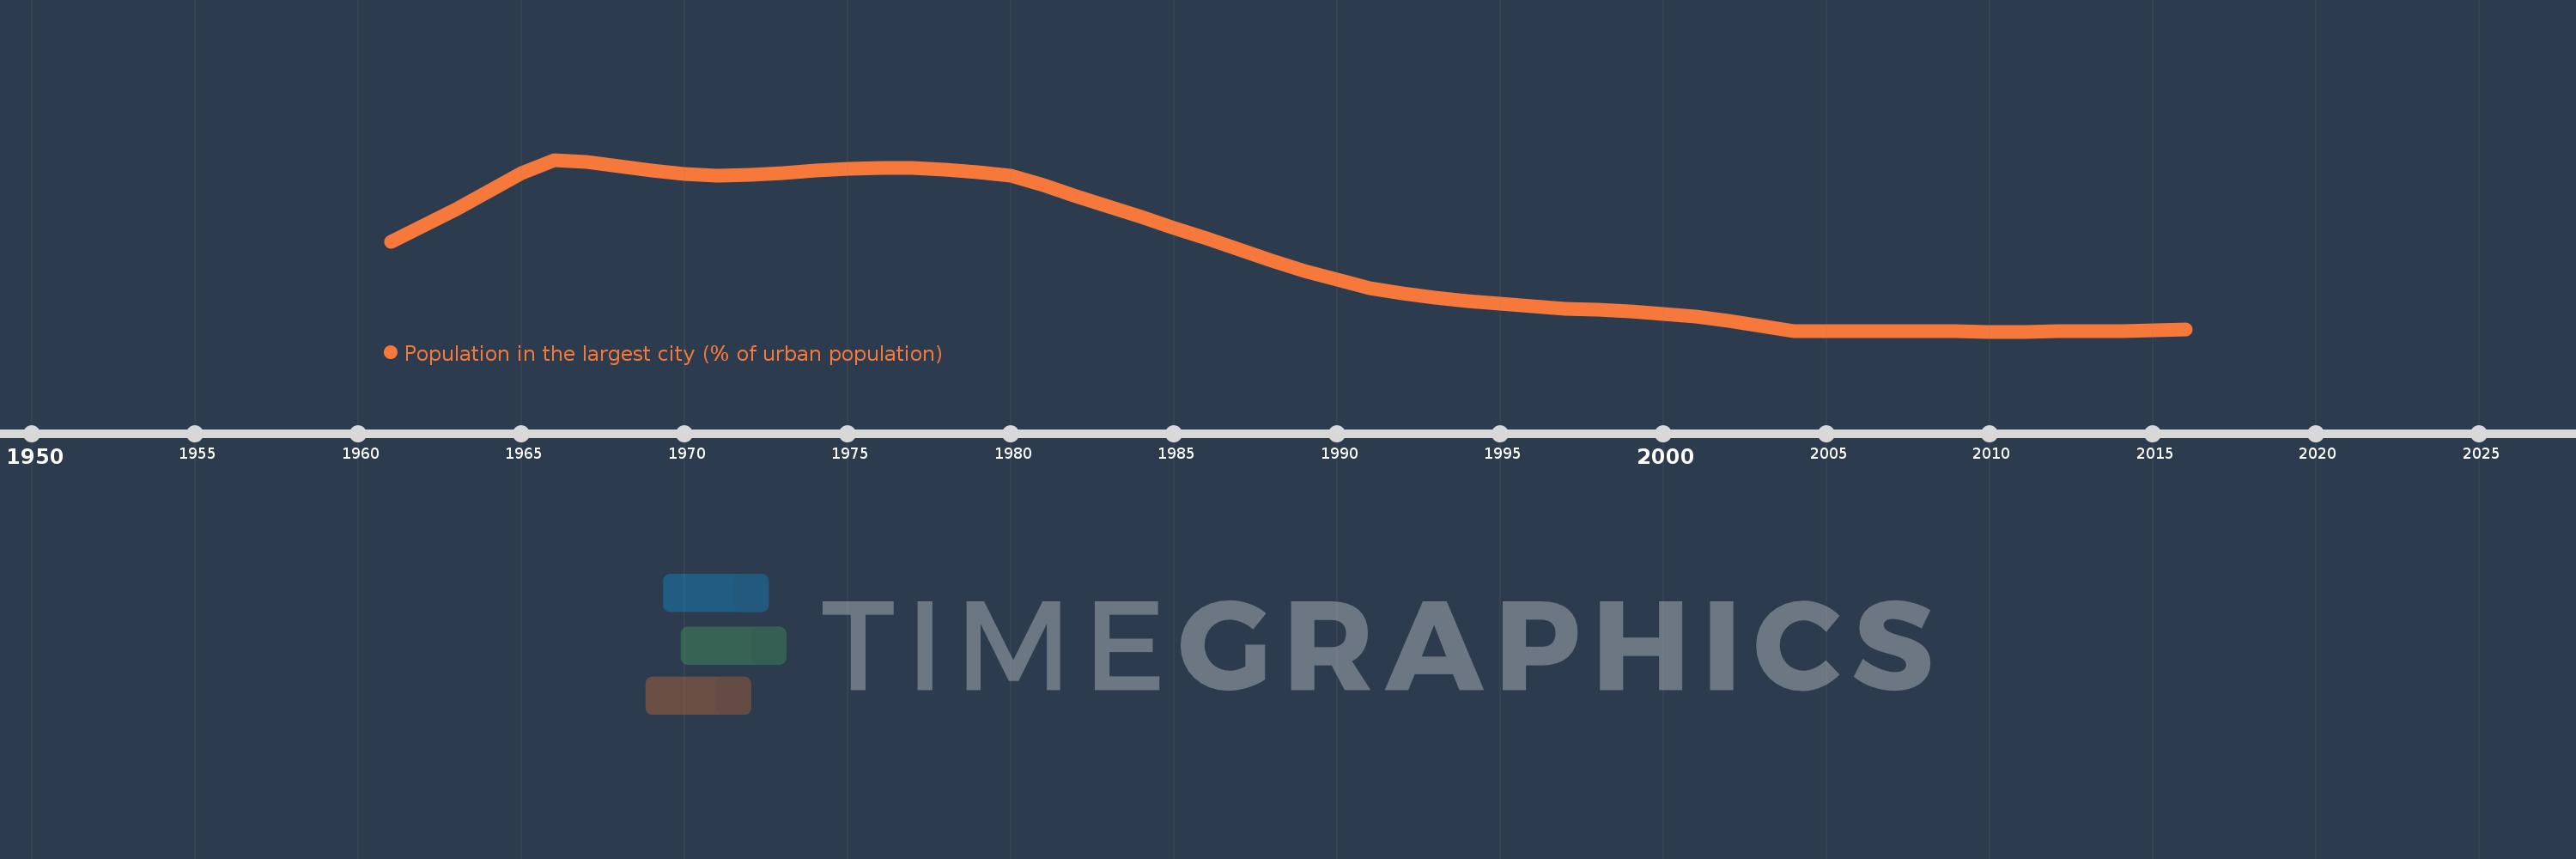
Population in the largest city (% of urban population)
2016,2015,2014,2013,2012,2011,2010,2009,2008,2007,2006,2005,2004,2003,2002,2001,2000,1999,1998,1997,1996,1995,1994,1993,1992,1991,1990,1989,1988,1987,1986,1985,1984,1983,1982,1981,1980,1979,1978,1977,1976,1975,1974,1973,1972,1971,1970,1969,1968,1967,1966,1965,1964,1963,1962,1961
Estas estatísticas em outros países:
AfghanistanAlbaniaAlgeriaAngolaArab WorldArgentinaArmeniaAustraliaAustriaAzerbaijanBahrainBangladeshBelarusBelgiumBeninBoliviaBosnia and HerzegovinaBrazilBulgariaBurkina FasoBurundiCambodiaCameroonCanadaCentral African RepublicCentral Europe and the BalticsChadChileChinaColombiaCongo, Dem. Rep.Congo, Rep.Costa RicaCote d'IvoireCroatiaCubaCzech RepublicDenmarkDjiboutiDominican RepublicEarly-demographic dividendEast Asia & PacificEast Asia & Pacific (excluding high income)East Asia & Pacific (IDA & IBRD countries)EcuadorEgypt, Arab Rep.El SalvadorEritreaEstoniaEthiopiaEuro areaEurope & Central AsiaEurope & Central Asia (excluding high income)Europe & Central Asia (IDA & IBRD countries)European UnionFinlandFragile and conflict affected situationsFranceGabonGambia, TheGeorgiaGermanyGhanaGreeceGuatemalaGuineaGuinea-BissauHaitiHeavily indebted poor countries (HIPC)High incomeHondurasHong Kong SAR, ChinaHungaryIBRD onlyIDA & IBRD totalIDA blendIDA onlyIDA totalIndiaIndonesiaIran, Islamic Rep.IraqIrelandIsraelItalyJamaicaJapanJordanKazakhstanKenyaKorea, Dem. People’s Rep.Korea, Rep.KuwaitKyrgyz RepublicLao PDRLate-demographic dividendLatin America & Caribbean Latin America & Caribbean (excluding high income)Latin America & the Caribbean (IDA & IBRD countries)LatviaLeast developed countries: UN classificationLebanonLiberiaLibyaLithuaniaLow & middle incomeLow incomeLower middle incomeMacao SAR, ChinaMacedonia, FYRMadagascarMalawiMalaysiaMaliMauritaniaMexicoMiddle East & North AfricaMiddle East & North Africa (excluding high income)Middle East & North Africa (IDA & IBRD countries)Middle incomeMoldovaMongoliaMoroccoMozambiqueMyanmarNamibiaNepalNetherlandsNew ZealandNicaraguaNigerNigeriaNorth AmericaNorwayOECD membersOmanPakistanPanamaPapua New GuineaParaguayPeruPhilippinesPolandPortugalPost-demographic dividendPre-demographic dividendPuerto RicoQatarRomaniaRussian FederationRwandaSaudi ArabiaSenegalSerbiaSierra LeoneSingaporeSlovak RepublicSomaliaSouth AfricaSouth AsiaSouth Asia (IDA & IBRD)South SudanSpainSri LankaSub-Saharan Africa Sub-Saharan Africa (excluding high income)Sub-Saharan Africa (IDA & IBRD countries)SudanSwedenSwitzerlandSyrian Arab RepublicTajikistanTanzaniaThailandTogoTunisiaTurkeyTurkmenistanUgandaUkraineUnited Arab EmiratesUnited KingdomUnited StatesUpper middle incomeUruguayUzbekistanVenezuela, RBVietnamWest Bank and GazaWorldYemen, Rep.ZambiaZimbabwe Linha do tempo:
Nesta escala de tempo está apresentado um gráfico de 1961 ano até 2016 ano Burundi. Dados de 1960 ano ausente. O número de observações reais por data: 56.
Fonte (nome):
Indicadores de desenvolvimento mundial
Fonte (organização):
United Nations, World Urbanization Prospects.
Categorias:
Urban Development
Foi atualizado:
23 abr 2017 ano
Indicadores de alterações dos valores ao longo dos anos
Mínimo:
55.259
1 jan 2011 ano
Máximo:
100.0
1 jan 1966 ano
Na data de observação
Valor
Mudança absoluta
A alteração em relação ao valor anterior
1 jan 1961 ano
78.72
+78.72
0.0%
1 jan 1962 ano
82.844
+4.124
5.24%
1 jan 1963 ano
87.199
+4.355
5.26%
1 jan 1964 ano
91.774
+4.575
5.25%
1 jan 1965 ano
96.475
+4.7
5.12%
1 jan 1966 ano
100.0
+3.525
3.65%
1 jan 1967 ano
99.539
-0.461
-0.46%
1 jan 1968 ano
98.325
-1.214
-1.22%
1 jan 1969 ano
97.192
-1.133
-1.15%
1 jan 1970 ano
96.296
-0.896
-0.92%
1 jan 1971 ano
95.816
-0.48
-0.5%
1 jan 1972 ano
96.017
+0.201
0.21%
1 jan 1973 ano
96.524
+0.506
0.53%
1 jan 1974 ano
97.193
+0.67
0.69%
1 jan 1975 ano
97.738
+0.545
0.56%
1 jan 1976 ano
97.949
+0.211
0.22%
1 jan 1977 ano
97.846
-0.104
-0.11%
1 jan 1978 ano
97.415
-0.431
-0.44%
1 jan 1979 ano
96.75
-0.665
-0.68%
1 jan 1980 ano
95.964
-0.786
-0.81%
1 jan 1981 ano
93.388
-2.576
-2.68%
1 jan 1982 ano
90.593
-2.795
-2.99%
1 jan 1983 ano
87.804
-2.788
-3.08%
1 jan 1984 ano
85.04
-2.765
-3.15%
1 jan 1985 ano
82.239
-2.801
-3.29%
1 jan 1986 ano
79.429
-2.81
-3.42%
1 jan 1987 ano
76.585
-2.844
-3.58%
1 jan 1988 ano
73.784
-2.802
-3.66%
1 jan 1989 ano
71.129
-2.654
-3.6%
1 jan 1990 ano
68.716
-2.413
-3.39%
1 jan 1991 ano
66.602
-2.114
-3.08%
1 jan 1992 ano
65.247
-1.355
-2.03%
1 jan 1993 ano
64.153
-1.094
-1.68%
1 jan 1994 ano
63.23
-0.923
-1.44%
1 jan 1995 ano
62.46
-0.77
-1.22%
1 jan 1996 ano
61.806
-0.654
-1.05%
1 jan 1997 ano
61.294
-0.512
-0.83%
1 jan 1998 ano
60.868
-0.425
-0.69%
1 jan 1999 ano
60.415
-0.453
-0.74%
1 jan 2000 ano
59.883
-0.532
-0.88%
1 jan 2001 ano
59.108
-0.775
-1.29%
1 jan 2002 ano
58.062
-1.046
-1.77%
1 jan 2003 ano
56.806
-1.256
-2.16%
1 jan 2004 ano
55.42
-1.386
-2.44%
1 jan 2005 ano
55.418
-0.002
0.0%
1 jan 2006 ano
55.392
-0.026
-0.05%
1 jan 2007 ano
55.361
-0.031
-0.06%
1 jan 2008 ano
55.32
-0.041
-0.07%
1 jan 2009 ano
55.281
-0.04
-0.07%
1 jan 2010 ano
55.259
-0.021
-0.04%
1 jan 2011 ano
55.259
0.0
0.0%
1 jan 2012 ano
55.295
+0.036
0.07%
1 jan 2013 ano
55.369
+0.074
0.13%
1 jan 2014 ano
55.471
+0.102
0.18%
1 jan 2015 ano
55.589
+0.118
0.21%
1 jan 2016 ano
55.708
+0.119
0.21%
Classificação de países por estatísticas atuais por anos


Comentários: