29
/pt/
pt
AIzaSyAYiBZKx7MnpbEhh9jyipgxe19OcubqV5w
April 1, 2024
274092
Ukraine
UKR
true
2
1
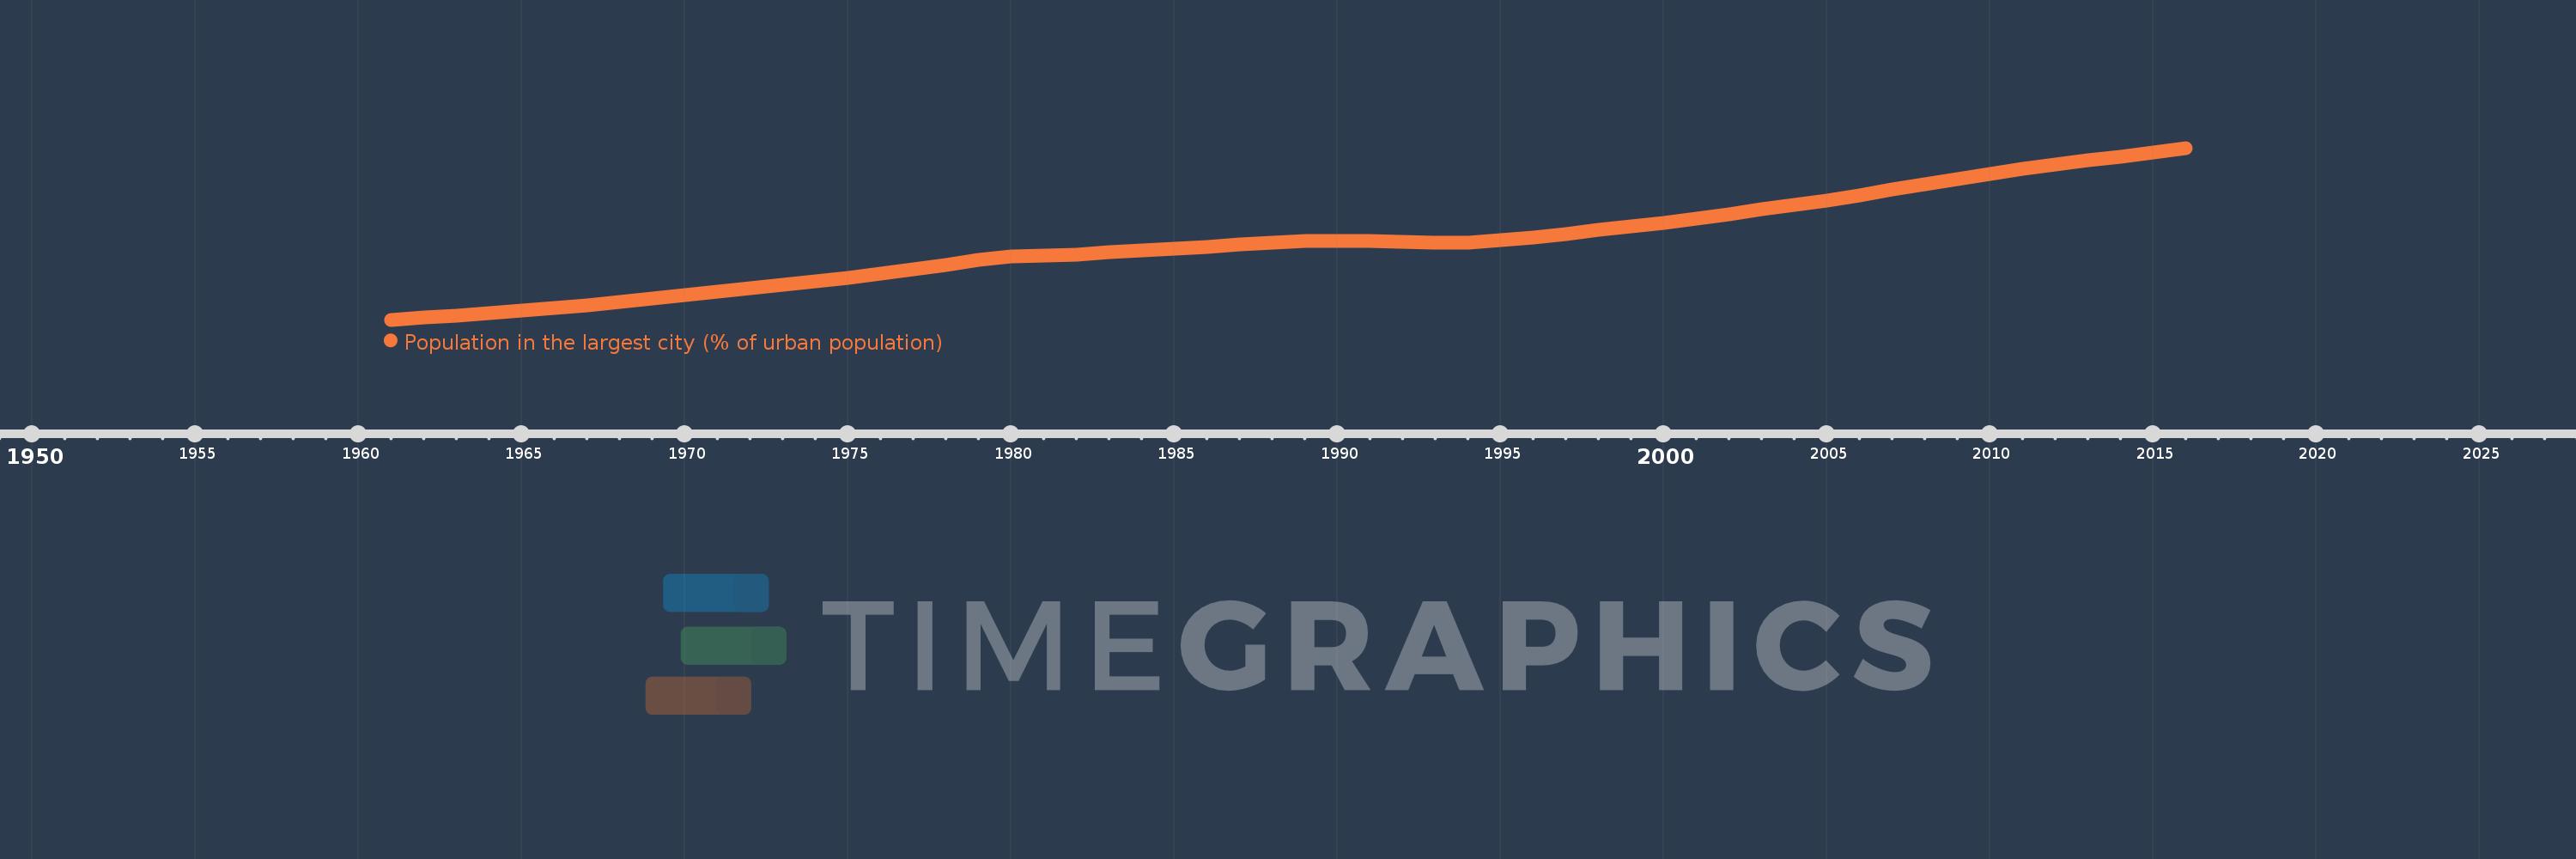
Population in the largest city (% of urban population)
2016,2015,2014,2013,2012,2011,2010,2009,2008,2007,2006,2005,2004,2003,2002,2001,2000,1999,1998,1997,1996,1995,1994,1993,1992,1991,1990,1989,1988,1987,1986,1985,1984,1983,1982,1981,1980,1979,1978,1977,1976,1975,1974,1973,1972,1971,1970,1969,1968,1967,1966,1965,1964,1963,1962,1961
Estas estatísticas em outros países:
AfghanistanAlbaniaAlgeriaAngolaArab WorldArgentinaArmeniaAustraliaAustriaAzerbaijanBahrainBangladeshBelarusBelgiumBeninBoliviaBosnia and HerzegovinaBrazilBulgariaBurkina FasoBurundiCambodiaCameroonCanadaCentral African RepublicCentral Europe and the BalticsChadChileChinaColombiaCongo, Dem. Rep.Congo, Rep.Costa RicaCote d'IvoireCroatiaCubaCzech RepublicDenmarkDjiboutiDominican RepublicEarly-demographic dividendEast Asia & PacificEast Asia & Pacific (excluding high income)East Asia & Pacific (IDA & IBRD countries)EcuadorEgypt, Arab Rep.El SalvadorEritreaEstoniaEthiopiaEuro areaEurope & Central AsiaEurope & Central Asia (excluding high income)Europe & Central Asia (IDA & IBRD countries)European UnionFinlandFragile and conflict affected situationsFranceGabonGambia, TheGeorgiaGermanyGhanaGreeceGuatemalaGuineaGuinea-BissauHaitiHeavily indebted poor countries (HIPC)High incomeHondurasHong Kong SAR, ChinaHungaryIBRD onlyIDA & IBRD totalIDA blendIDA onlyIDA totalIndiaIndonesiaIran, Islamic Rep.IraqIrelandIsraelItalyJamaicaJapanJordanKazakhstanKenyaKorea, Dem. People’s Rep.Korea, Rep.KuwaitKyrgyz RepublicLao PDRLate-demographic dividendLatin America & Caribbean Latin America & Caribbean (excluding high income)Latin America & the Caribbean (IDA & IBRD countries)LatviaLeast developed countries: UN classificationLebanonLiberiaLibyaLithuaniaLow & middle incomeLow incomeLower middle incomeMacao SAR, ChinaMacedonia, FYRMadagascarMalawiMalaysiaMaliMauritaniaMexicoMiddle East & North AfricaMiddle East & North Africa (excluding high income)Middle East & North Africa (IDA & IBRD countries)Middle incomeMoldovaMongoliaMoroccoMozambiqueMyanmarNamibiaNepalNetherlandsNew ZealandNicaraguaNigerNigeriaNorth AmericaNorwayOECD membersOmanPakistanPanamaPapua New GuineaParaguayPeruPhilippinesPolandPortugalPost-demographic dividendPre-demographic dividendPuerto RicoQatarRomaniaRussian FederationRwandaSaudi ArabiaSenegalSerbiaSierra LeoneSingaporeSlovak RepublicSomaliaSouth AfricaSouth AsiaSouth Asia (IDA & IBRD)South SudanSpainSri LankaSub-Saharan Africa Sub-Saharan Africa (excluding high income)Sub-Saharan Africa (IDA & IBRD countries)SudanSwedenSwitzerlandSyrian Arab RepublicTajikistanTanzaniaThailandTogoTunisiaTurkeyTurkmenistanUgandaUkraineUnited Arab EmiratesUnited KingdomUnited StatesUpper middle incomeUruguayUzbekistanVenezuela, RBVietnamWest Bank and GazaWorldYemen, Rep.ZambiaZimbabwe Linha do tempo:
Nesta escala de tempo está apresentado um gráfico de 1961 ano até 2016 ano Ukraine. Dados de 1960 ano ausente. O número de observações reais por data: 56.
Fonte (nome):
Indicadores de desenvolvimento mundial
Fonte (organização):
United Nations, World Urbanization Prospects.
Categorias:
Urban Development
Foi atualizado:
23 abr 2017 ano
Indicadores de alterações dos valores ao longo dos anos
Mínimo:
5.826
1 jan 1961 ano
Máximo:
9.339
1 jan 2016 ano
Na data de observação
Valor
Mudança absoluta
A alteração em relação ao valor anterior
1 jan 1961 ano
5.826
+5.826
0.0%
1 jan 1962 ano
5.867
+0.041
0.7%
1 jan 1963 ano
5.909
+0.043
0.73%
1 jan 1964 ano
5.956
+0.047
0.79%
1 jan 1965 ano
6.009
+0.053
0.89%
1 jan 1966 ano
6.059
+0.049
0.82%
1 jan 1967 ano
6.117
+0.059
0.97%
1 jan 1968 ano
6.184
+0.067
1.1%
1 jan 1969 ano
6.258
+0.074
1.2%
1 jan 1970 ano
6.337
+0.078
1.25%
1 jan 1971 ano
6.409
+0.073
1.15%
1 jan 1972 ano
6.473
+0.064
1.0%
1 jan 1973 ano
6.539
+0.066
1.02%
1 jan 1974 ano
6.608
+0.069
1.05%
1 jan 1975 ano
6.682
+0.074
1.12%
1 jan 1976 ano
6.764
+0.082
1.23%
1 jan 1977 ano
6.852
+0.089
1.31%
1 jan 1978 ano
6.947
+0.094
1.37%
1 jan 1979 ano
7.046
+0.1
1.44%
1 jan 1980 ano
7.114
+0.068
0.96%
1 jan 1981 ano
7.141
+0.027
0.38%
1 jan 1982 ano
7.164
+0.023
0.33%
1 jan 1983 ano
7.202
+0.037
0.52%
1 jan 1984 ano
7.238
+0.036
0.51%
1 jan 1985 ano
7.275
+0.037
0.5%
1 jan 1986 ano
7.317
+0.043
0.59%
1 jan 1987 ano
7.359
+0.042
0.57%
1 jan 1988 ano
7.4
+0.041
0.56%
1 jan 1989 ano
7.438
+0.038
0.51%
1 jan 1990 ano
7.442
+0.004
0.06%
1 jan 1991 ano
7.43
-0.012
-0.16%
1 jan 1992 ano
7.419
-0.011
-0.14%
1 jan 1993 ano
7.403
-0.016
-0.22%
1 jan 1994 ano
7.404
+0.001
0.01%
1 jan 1995 ano
7.446
+0.042
0.57%
1 jan 1996 ano
7.51
+0.064
0.86%
1 jan 1997 ano
7.582
+0.072
0.96%
1 jan 1998 ano
7.657
+0.075
0.98%
1 jan 1999 ano
7.731
+0.074
0.97%
1 jan 2000 ano
7.809
+0.078
1.02%
1 jan 2001 ano
7.893
+0.084
1.08%
1 jan 2002 ano
7.979
+0.085
1.08%
1 jan 2003 ano
8.079
+0.1
1.25%
1 jan 2004 ano
8.177
+0.098
1.21%
1 jan 2005 ano
8.269
+0.092
1.12%
1 jan 2006 ano
8.371
+0.103
1.24%
1 jan 2007 ano
8.488
+0.116
1.39%
1 jan 2008 ano
8.599
+0.111
1.31%
1 jan 2009 ano
8.708
+0.108
1.26%
1 jan 2010 ano
8.808
+0.101
1.16%
1 jan 2011 ano
8.906
+0.097
1.1%
1 jan 2012 ano
9.0
+0.094
1.06%
1 jan 2013 ano
9.084
+0.084
0.93%
1 jan 2014 ano
9.166
+0.082
0.91%
1 jan 2015 ano
9.253
+0.087
0.95%
1 jan 2016 ano
9.339
+0.086
0.93%
Classificação de países por estatísticas atuais por anos


Comentários: