29
/pt/
pt
AIzaSyAYiBZKx7MnpbEhh9jyipgxe19OcubqV5w
April 1, 2024
227788
Qatar
QAT
true
2
1
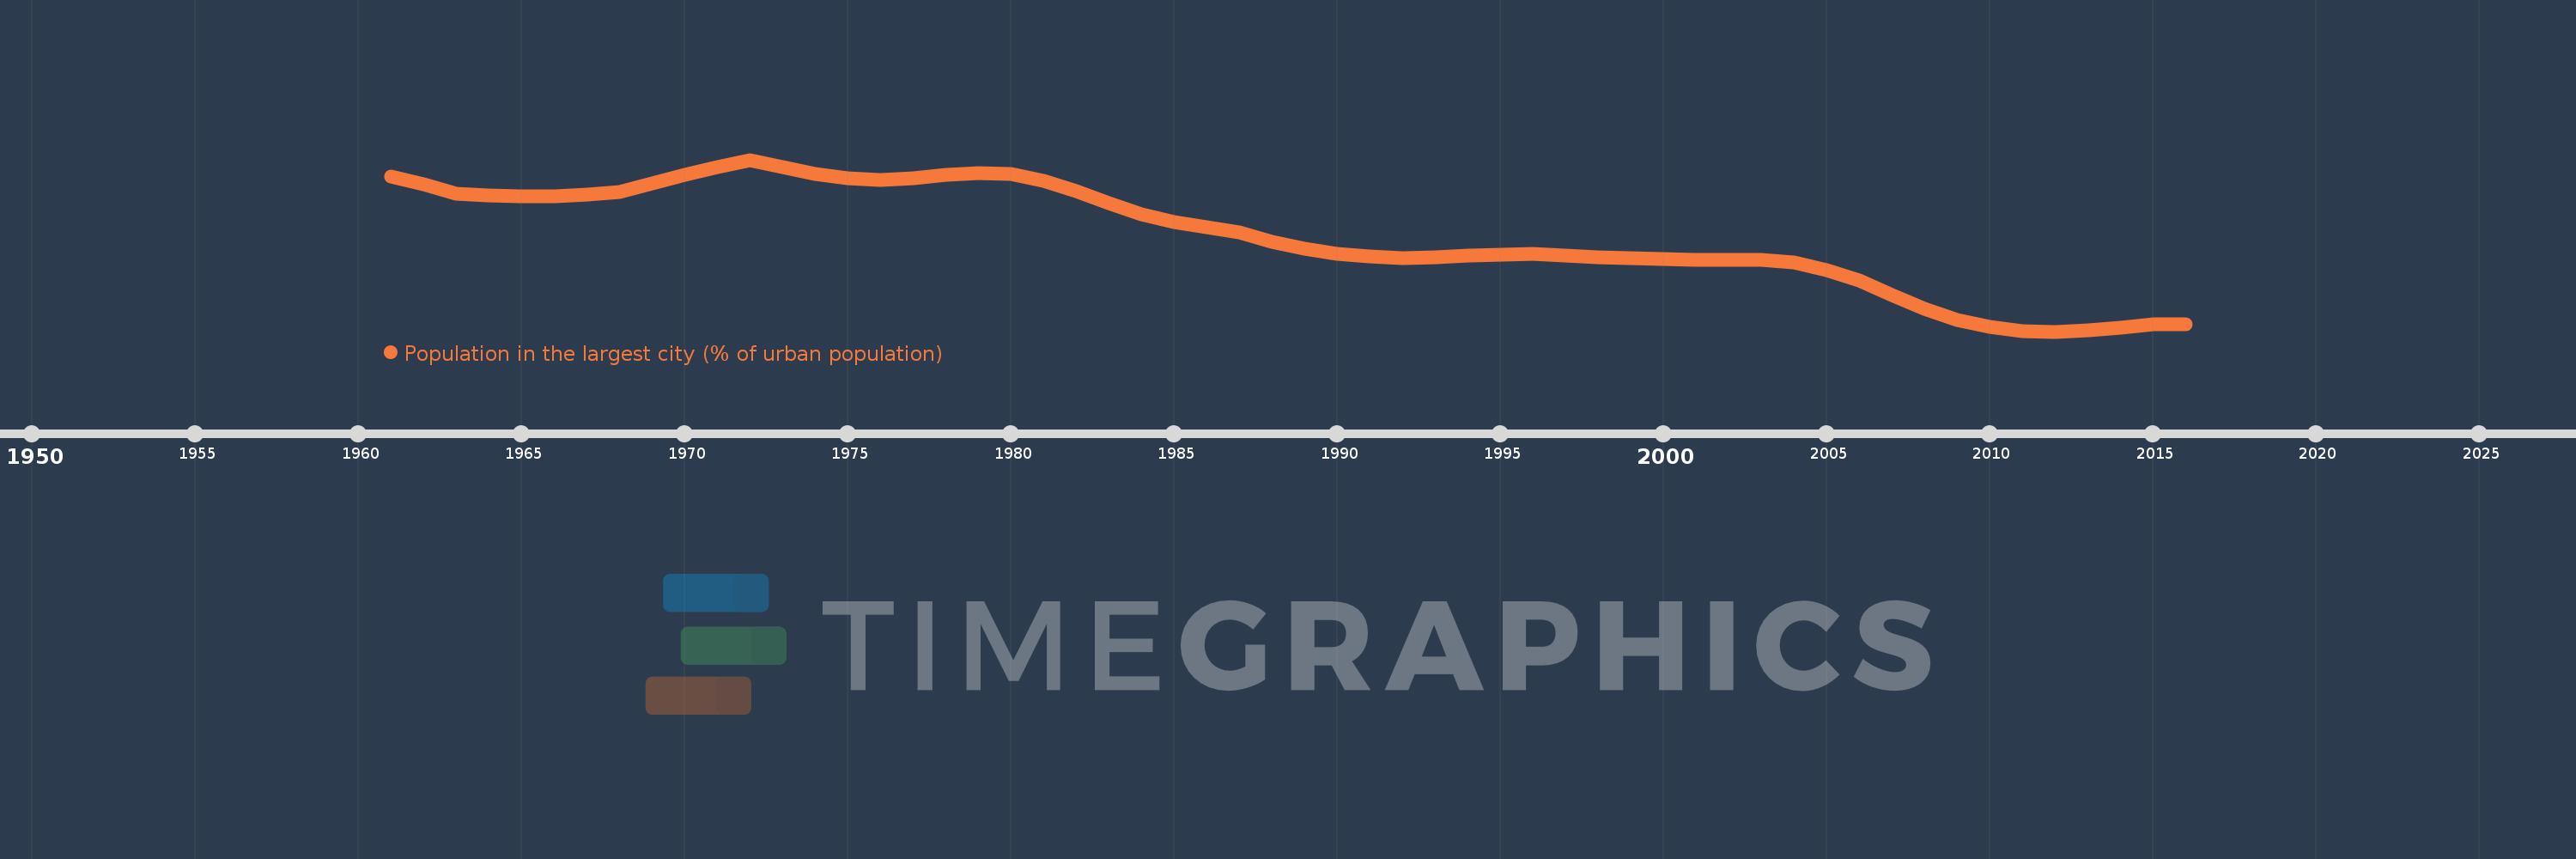
Population in the largest city (% of urban population)
2016,2015,2014,2013,2012,2011,2010,2009,2008,2007,2006,2005,2004,2003,2002,2001,2000,1999,1998,1997,1996,1995,1994,1993,1992,1991,1990,1989,1988,1987,1986,1985,1984,1983,1982,1981,1980,1979,1978,1977,1976,1975,1974,1973,1972,1971,1970,1969,1968,1967,1966,1965,1964,1963,1962,1961
Estas estatísticas em outros países:
AfghanistanAlbaniaAlgeriaAngolaArab WorldArgentinaArmeniaAustraliaAustriaAzerbaijanBahrainBangladeshBelarusBelgiumBeninBoliviaBosnia and HerzegovinaBrazilBulgariaBurkina FasoBurundiCambodiaCameroonCanadaCentral African RepublicCentral Europe and the BalticsChadChileChinaColombiaCongo, Dem. Rep.Congo, Rep.Costa RicaCote d'IvoireCroatiaCubaCzech RepublicDenmarkDjiboutiDominican RepublicEarly-demographic dividendEast Asia & PacificEast Asia & Pacific (excluding high income)East Asia & Pacific (IDA & IBRD countries)EcuadorEgypt, Arab Rep.El SalvadorEritreaEstoniaEthiopiaEuro areaEurope & Central AsiaEurope & Central Asia (excluding high income)Europe & Central Asia (IDA & IBRD countries)European UnionFinlandFragile and conflict affected situationsFranceGabonGambia, TheGeorgiaGermanyGhanaGreeceGuatemalaGuineaGuinea-BissauHaitiHeavily indebted poor countries (HIPC)High incomeHondurasHong Kong SAR, ChinaHungaryIBRD onlyIDA & IBRD totalIDA blendIDA onlyIDA totalIndiaIndonesiaIran, Islamic Rep.IraqIrelandIsraelItalyJamaicaJapanJordanKazakhstanKenyaKorea, Dem. People’s Rep.Korea, Rep.KuwaitKyrgyz RepublicLao PDRLate-demographic dividendLatin America & Caribbean Latin America & Caribbean (excluding high income)Latin America & the Caribbean (IDA & IBRD countries)LatviaLeast developed countries: UN classificationLebanonLiberiaLibyaLithuaniaLow & middle incomeLow incomeLower middle incomeMacao SAR, ChinaMacedonia, FYRMadagascarMalawiMalaysiaMaliMauritaniaMexicoMiddle East & North AfricaMiddle East & North Africa (excluding high income)Middle East & North Africa (IDA & IBRD countries)Middle incomeMoldovaMongoliaMoroccoMozambiqueMyanmarNamibiaNepalNetherlandsNew ZealandNicaraguaNigerNigeriaNorth AmericaNorwayOECD membersOmanPakistanPanamaPapua New GuineaParaguayPeruPhilippinesPolandPortugalPost-demographic dividendPre-demographic dividendPuerto RicoQatarRomaniaRussian FederationRwandaSaudi ArabiaSenegalSerbiaSierra LeoneSingaporeSlovak RepublicSomaliaSouth AfricaSouth AsiaSouth Asia (IDA & IBRD)South SudanSpainSri LankaSub-Saharan Africa Sub-Saharan Africa (excluding high income)Sub-Saharan Africa (IDA & IBRD countries)SudanSwedenSwitzerlandSyrian Arab RepublicTajikistanTanzaniaThailandTogoTunisiaTurkeyTurkmenistanUgandaUkraineUnited Arab EmiratesUnited KingdomUnited StatesUpper middle incomeUruguayUzbekistanVenezuela, RBVietnamWest Bank and GazaWorldYemen, Rep.ZambiaZimbabwe Linha do tempo:
Nesta escala de tempo está apresentado um gráfico de 1961 ano até 2016 ano Qatar. Dados de 1960 ano ausente. O número de observações reais por data: 56.
Fonte (nome):
Indicadores de desenvolvimento mundial
Fonte (organização):
United Nations, World Urbanization Prospects.
Categorias:
Urban Development
Foi atualizado:
23 abr 2017 ano
Indicadores de alterações dos valores ao longo dos anos
Mínimo:
30.097
1 jan 2012 ano
Máximo:
82.819
1 jan 1972 ano
Na data de observação
Valor
Mudança absoluta
A alteração em relação ao valor anterior
1 jan 1961 ano
77.555
+77.555
0.0%
1 jan 1962 ano
75.193
-2.362
-3.05%
1 jan 1963 ano
72.347
-2.846
-3.79%
1 jan 1964 ano
71.844
-0.503
-0.69%
1 jan 1965 ano
71.614
-0.23
-0.32%
1 jan 1966 ano
71.699
+0.084
0.12%
1 jan 1967 ano
72.165
+0.466
0.65%
1 jan 1968 ano
72.88
+0.715
0.99%
1 jan 1969 ano
75.584
+2.704
3.71%
1 jan 1970 ano
78.195
+2.611
3.45%
1 jan 1971 ano
80.656
+2.461
3.15%
1 jan 1972 ano
82.819
+2.163
2.68%
1 jan 1973 ano
80.517
-2.302
-2.78%
1 jan 1974 ano
78.507
-2.01
-2.5%
1 jan 1975 ano
77.205
-1.302
-1.66%
1 jan 1976 ano
76.697
-0.508
-0.66%
1 jan 1977 ano
77.106
+0.408
0.53%
1 jan 1978 ano
78.08
+0.974
1.26%
1 jan 1979 ano
78.822
+0.742
0.95%
1 jan 1980 ano
78.381
-0.441
-0.56%
1 jan 1981 ano
76.373
-2.008
-2.56%
1 jan 1982 ano
73.145
-3.229
-4.23%
1 jan 1983 ano
69.504
-3.641
-4.98%
1 jan 1984 ano
66.17
-3.333
-4.8%
1 jan 1985 ano
63.693
-2.478
-3.74%
1 jan 1986 ano
62.213
-1.48
-2.32%
1 jan 1987 ano
60.66
-1.553
-2.5%
1 jan 1988 ano
57.682
-2.978
-4.91%
1 jan 1989 ano
55.458
-2.224
-3.86%
1 jan 1990 ano
53.935
-1.523
-2.75%
1 jan 1991 ano
53.046
-0.889
-1.65%
1 jan 1992 ano
52.749
-0.297
-0.56%
1 jan 1993 ano
52.929
+0.18
0.34%
1 jan 1994 ano
53.357
+0.429
0.81%
1 jan 1995 ano
53.744
+0.387
0.72%
1 jan 1996 ano
53.851
+0.107
0.2%
1 jan 1997 ano
53.455
-0.396
-0.74%
1 jan 1998 ano
52.883
-0.572
-1.07%
1 jan 1999 ano
52.66
-0.223
-0.42%
1 jan 2000 ano
52.368
-0.292
-0.55%
1 jan 2001 ano
52.095
-0.273
-0.52%
1 jan 2002 ano
52.116
+0.021
0.04%
1 jan 2003 ano
52.169
+0.053
0.1%
1 jan 2004 ano
51.257
-0.912
-1.75%
1 jan 2005 ano
48.929
-2.328
-4.54%
1 jan 2006 ano
45.725
-3.204
-6.55%
1 jan 2007 ano
41.383
-4.343
-9.5%
1 jan 2008 ano
37.099
-4.283
-10.35%
1 jan 2009 ano
33.686
-3.414
-9.2%
1 jan 2010 ano
31.459
-2.227
-6.61%
1 jan 2011 ano
30.343
-1.116
-3.55%
1 jan 2012 ano
30.097
-0.246
-0.81%
1 jan 2013 ano
30.466
+0.368
1.22%
1 jan 2014 ano
31.298
+0.832
2.73%
1 jan 2015 ano
32.433
+1.135
3.63%
1 jan 2016 ano
32.355
-0.077
-0.24%
Classificação de países por estatísticas atuais por anos


Comentários: