29
/pt/
pt
AIzaSyAYiBZKx7MnpbEhh9jyipgxe19OcubqV5w
April 1, 2024
94799
Burkina Faso
BFA
true
2
1
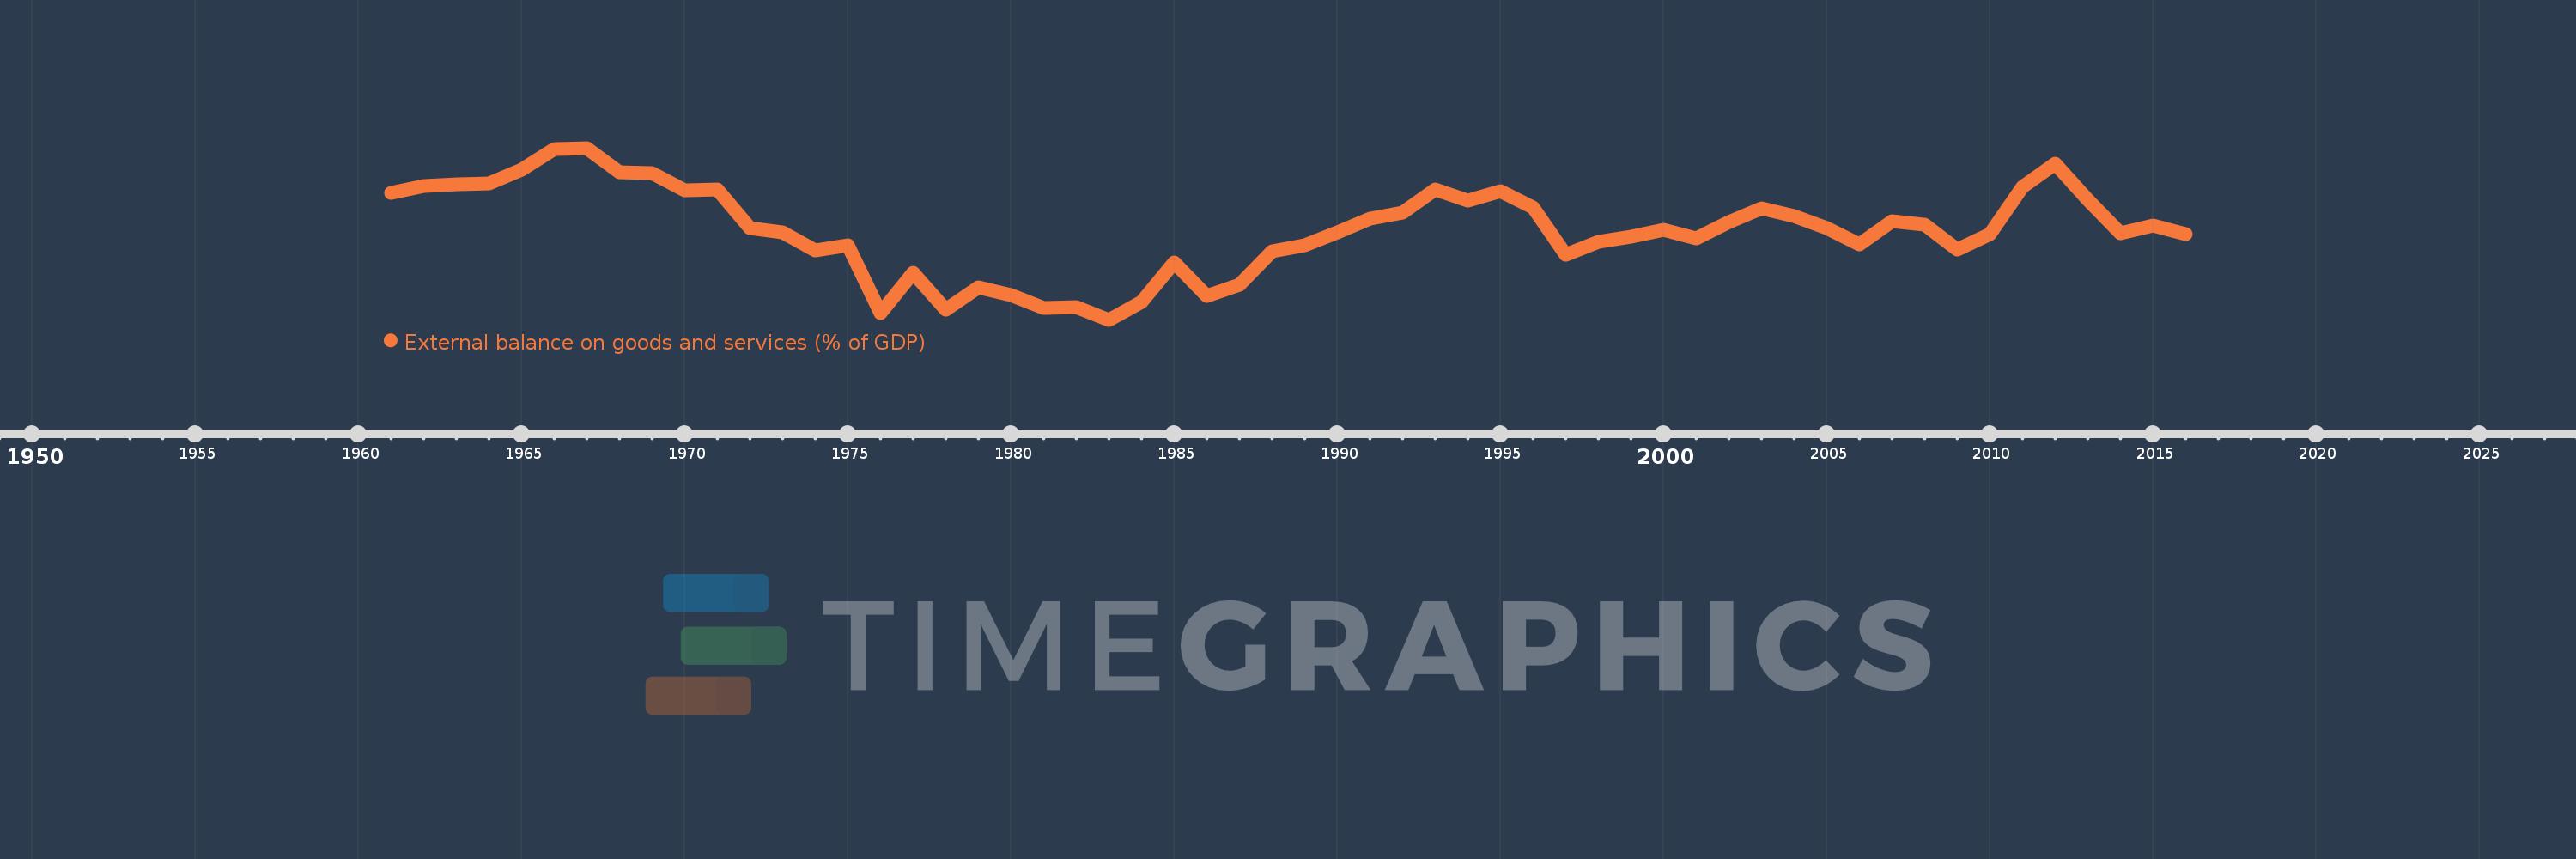
External balance on goods and services (% of GDP)
2016,2015,2014,2013,2012,2011,2010,2009,2008,2007,2006,2005,2004,2003,2002,2001,2000,1999,1998,1997,1996,1995,1994,1993,1992,1991,1990,1989,1988,1987,1986,1985,1984,1983,1982,1981,1980,1979,1978,1977,1976,1975,1974,1973,1972,1971,1970,1969,1968,1967,1966,1965,1964,1963,1962,1961
Estas estatísticas em outros países:
AfghanistanAlbaniaAlgeriaAngolaAntigua and BarbudaArab WorldArgentinaArmeniaArubaAustraliaAustriaAzerbaijanBahamas, TheBahrainBangladeshBarbadosBelarusBelgiumBelizeBeninBermudaBhutanBoliviaBosnia and HerzegovinaBotswanaBrazilBrunei DarussalamBulgariaBurkina FasoBurundiCabo VerdeCambodiaCameroonCanadaCaribbean small statesCentral African RepublicCentral Europe and the BalticsChadChileChinaColombiaComorosCongo, Dem. Rep.Congo, Rep.Costa RicaCote d'IvoireCroatiaCubaCyprusCzech RepublicDenmarkDjiboutiDominicaDominican RepublicEarly-demographic dividendEast Asia & PacificEast Asia & Pacific (excluding high income)East Asia & Pacific (IDA & IBRD countries)EcuadorEgypt, Arab Rep.El SalvadorEquatorial GuineaEritreaEstoniaEthiopiaEuro areaEurope & Central AsiaEurope & Central Asia (excluding high income)Europe & Central Asia (IDA & IBRD countries)European UnionFaroe IslandsFijiFinlandFragile and conflict affected situationsFranceFrench PolynesiaGabonGambia, TheGeorgiaGermanyGhanaGreeceGrenadaGuatemalaGuineaGuinea-BissauGuyanaHaitiHeavily indebted poor countries (HIPC)High incomeHondurasHong Kong SAR, ChinaHungaryIBRD onlyIcelandIDA & IBRD totalIDA blendIDA onlyIDA totalIndiaIndonesiaIran, Islamic Rep.IraqIrelandIsraelItalyJamaicaJapanJordanKazakhstanKenyaKiribatiKorea, Rep.KosovoKuwaitKyrgyz RepublicLao PDRLate-demographic dividendLatin America & Caribbean Latin America & Caribbean (excluding high income)Latin America & the Caribbean (IDA & IBRD countries)LatviaLeast developed countries: UN classificationLebanonLesothoLiberiaLibyaLithuaniaLow & middle incomeLow incomeLower middle incomeLuxembourgMacao SAR, ChinaMacedonia, FYRMadagascarMalawiMalaysiaMaldivesMaliMaltaMauritaniaMauritiusMexicoMicronesia, Fed. Sts.Middle East & North AfricaMiddle East & North Africa (excluding high income)Middle East & North Africa (IDA & IBRD countries)Middle incomeMoldovaMongoliaMontenegroMoroccoMozambiqueMyanmarNamibiaNepalNetherlandsNew CaledoniaNew ZealandNicaraguaNigerNigeriaNorth AmericaNorwayOECD membersOmanOther small statesPacific island small statesPakistanPalauPanamaPapua New GuineaParaguayPeruPhilippinesPolandPortugalPost-demographic dividendPre-demographic dividendPuerto RicoQatarRomaniaRussian FederationRwandaSamoaSaudi ArabiaSenegalSerbiaSeychellesSierra LeoneSingaporeSlovak RepublicSloveniaSmall statesSolomon IslandsSomaliaSouth AfricaSouth AsiaSouth Asia (IDA & IBRD)South SudanSpainSri LankaSt. Kitts and NevisSt. LuciaSt. Vincent and the GrenadinesSub-Saharan Africa Sub-Saharan Africa (excluding high income)Sub-Saharan Africa (IDA & IBRD countries)SudanSurinameSwazilandSwedenSwitzerlandSyrian Arab RepublicTajikistanTanzaniaThailandTimor-LesteTogoTongaTrinidad and TobagoTunisiaTurkeyTurkmenistanUgandaUkraineUnited Arab EmiratesUnited KingdomUnited StatesUpper middle incomeUruguayUzbekistanVanuatuVenezuela, RBVietnamWest Bank and GazaWorldYemen, Rep.ZambiaZimbabwe Linha do tempo:
Nesta escala de tempo está apresentado um gráfico de 1961 ano até 2016 ano Burkina Faso. Dados de 1960 ano ausente. O número de observações reais por data: 56.
Fonte (nome):
Indicadores de desenvolvimento mundial
Fonte (organização):
World Bank national accounts data, and OECD National Accounts data files.
Categorias:
Economy & Growth, Trade
Foi atualizado:
23 abr 2017 ano
Indicadores de alterações dos valores ao longo dos anos
Mínimo:
-23.428
1 jan 1983 ano
Máximo:
-6.597
1 jan 1967 ano
Na data de observação
Valor
Mudança absoluta
A alteração em relação ao valor anterior
1 jan 1961 ano
-10.977
-10.977
0.0%
1 jan 1962 ano
-10.361
+0.616
-5.61%
1 jan 1963 ano
-10.174
+0.187
-1.81%
1 jan 1964 ano
-10.09
+0.084
-0.83%
1 jan 1965 ano
-8.72
+1.37
-13.58%
1 jan 1966 ano
-6.724
+1.996
-22.89%
1 jan 1967 ano
-6.597
+0.127
-1.89%
1 jan 1968 ano
-8.999
-2.402
36.41%
1 jan 1969 ano
-9.083
-0.084
0.93%
1 jan 1970 ano
-10.715
-1.633
17.97%
1 jan 1971 ano
-10.687
+0.029
-0.27%
1 jan 1972 ano
-14.42
-3.733
34.93%
1 jan 1973 ano
-14.889
-0.47
3.26%
1 jan 1974 ano
-16.608
-1.718
11.54%
1 jan 1975 ano
-16.152
+0.456
-2.74%
1 jan 1976 ano
-22.803
-6.651
41.18%
1 jan 1977 ano
-18.803
+4.0
-17.54%
1 jan 1978 ano
-22.483
-3.68
19.57%
1 jan 1979 ano
-20.282
+2.201
-9.79%
1 jan 1980 ano
-21.036
-0.754
3.72%
1 jan 1981 ano
-22.312
-1.276
6.06%
1 jan 1982 ano
-22.159
+0.153
-0.69%
1 jan 1983 ano
-23.428
-1.27
5.73%
1 jan 1984 ano
-21.69
+1.738
-7.42%
1 jan 1985 ano
-17.797
+3.893
-17.95%
1 jan 1986 ano
-21.105
-3.308
18.59%
1 jan 1987 ano
-19.981
+1.124
-5.33%
1 jan 1988 ano
-16.722
+3.258
-16.31%
1 jan 1989 ano
-16.132
+0.59
-3.53%
1 jan 1990 ano
-14.897
+1.235
-7.66%
1 jan 1991 ano
-13.489
+1.408
-9.45%
1 jan 1992 ano
-12.901
+0.588
-4.36%
1 jan 1993 ano
-10.681
+2.22
-17.21%
1 jan 1994 ano
-11.722
-1.041
9.75%
1 jan 1995 ano
-10.826
+0.896
-7.64%
1 jan 1996 ano
-12.466
-1.64
15.15%
1 jan 1997 ano
-17.053
-4.587
36.79%
1 jan 1998 ano
-15.791
+1.262
-7.4%
1 jan 1999 ano
-15.324
+0.468
-2.96%
1 jan 2000 ano
-14.659
+0.664
-4.33%
1 jan 2001 ano
-15.447
-0.788
5.37%
1 jan 2002 ano
-13.882
+1.565
-10.13%
1 jan 2003 ano
-12.52
+1.363
-9.82%
1 jan 2004 ano
-13.312
-0.793
6.33%
1 jan 2005 ano
-14.472
-1.16
8.71%
1 jan 2006 ano
-16.048
-1.576
10.89%
1 jan 2007 ano
-13.741
+2.307
-14.38%
1 jan 2008 ano
-14.08
-0.34
2.47%
1 jan 2009 ano
-16.52
-2.44
17.33%
1 jan 2010 ano
-15.022
+1.498
-9.07%
1 jan 2011 ano
-10.413
+4.609
-30.68%
1 jan 2012 ano
-8.147
+2.267
-21.77%
1 jan 2013 ano
-11.642
-3.495
42.91%
1 jan 2014 ano
-14.951
-3.309
28.43%
1 jan 2015 ano
-14.183
+0.768
-5.14%
1 jan 2016 ano
-15.078
-0.894
6.3%
Classificação de países por estatísticas atuais por anos


Comentários: