29
/pt/
pt
AIzaSyAYiBZKx7MnpbEhh9jyipgxe19OcubqV5w
April 1, 2024
256281
Sweden
SWE
true
2
1
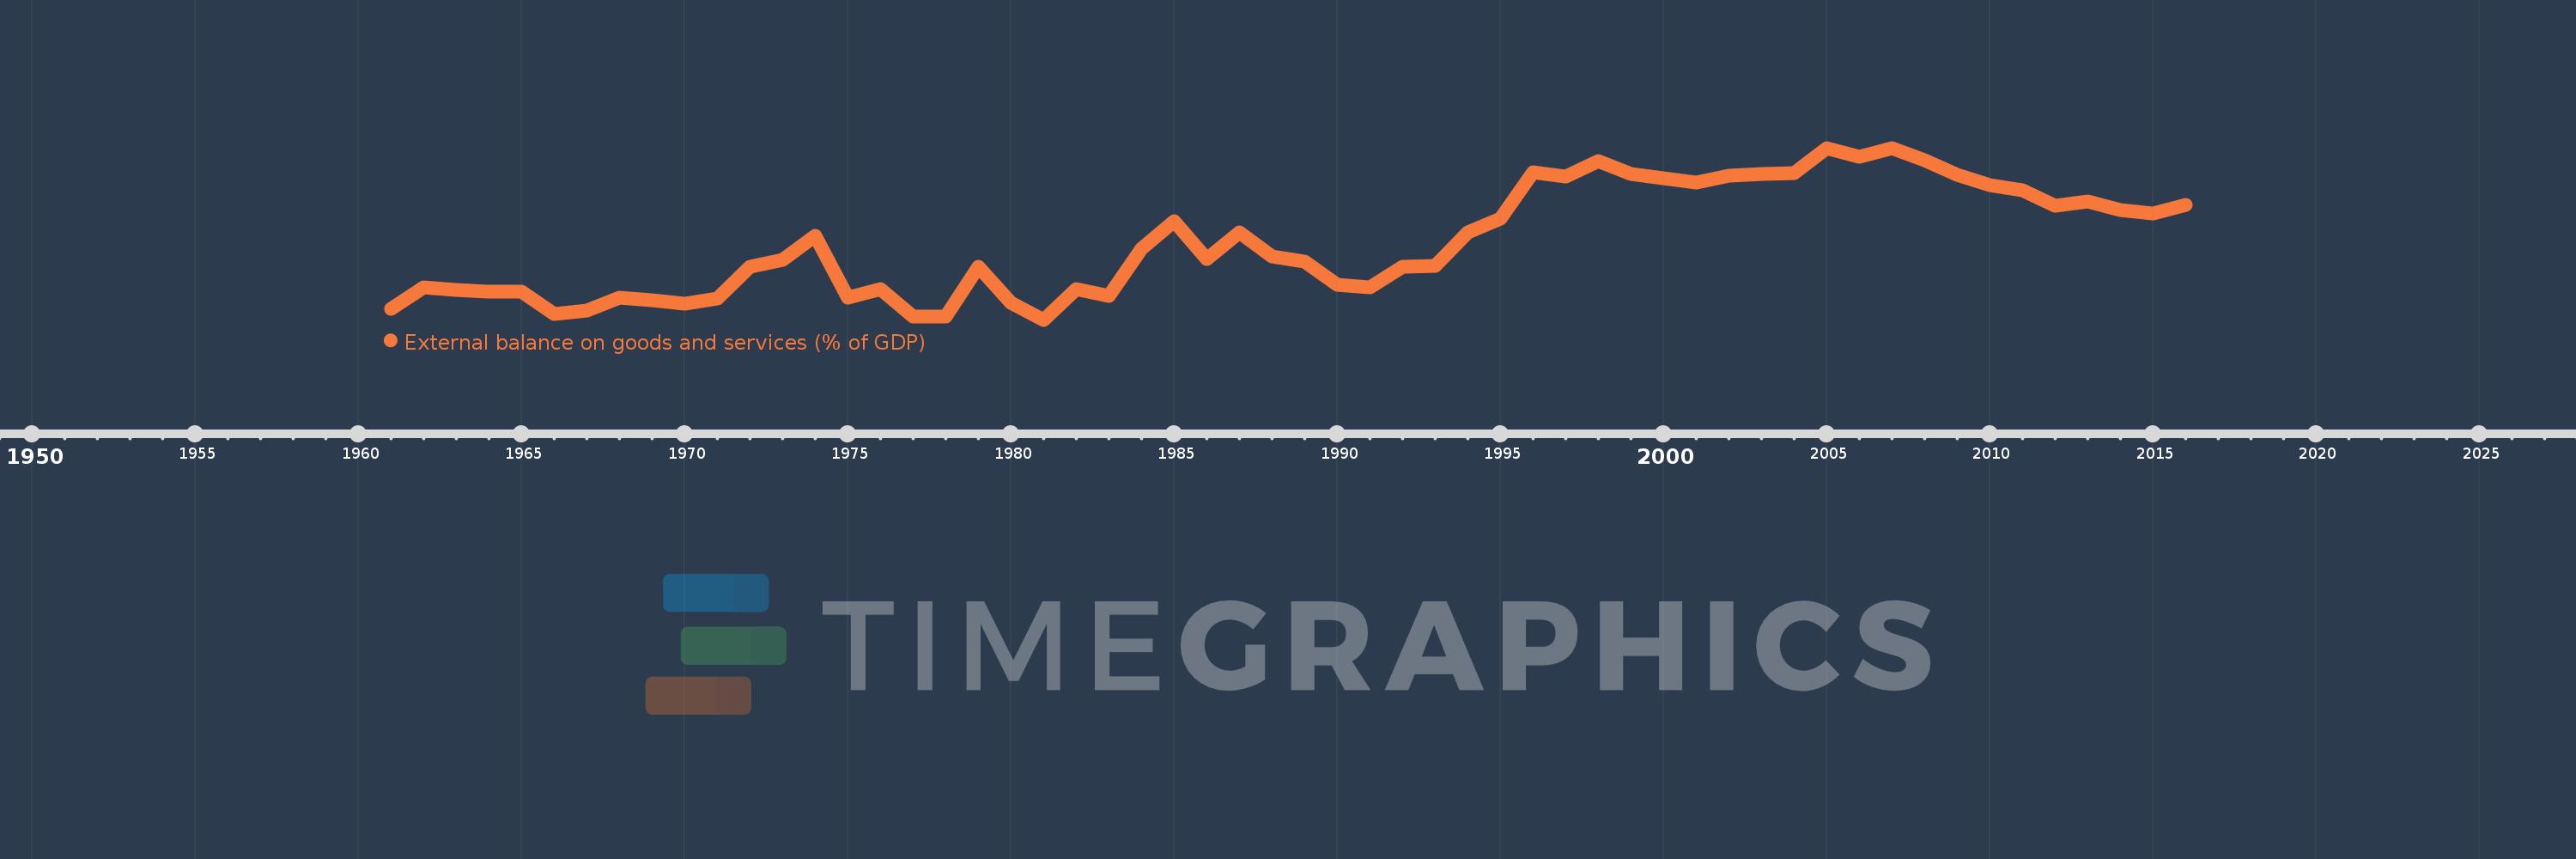
External balance on goods and services (% of GDP)
2016,2015,2014,2013,2012,2011,2010,2009,2008,2007,2006,2005,2004,2003,2002,2001,2000,1999,1998,1997,1996,1995,1994,1993,1992,1991,1990,1989,1988,1987,1986,1985,1984,1983,1982,1981,1980,1979,1978,1977,1976,1975,1974,1973,1972,1971,1970,1969,1968,1967,1966,1965,1964,1963,1962,1961
Estas estatísticas em outros países:
AfghanistanAlbaniaAlgeriaAngolaAntigua and BarbudaArab WorldArgentinaArmeniaArubaAustraliaAustriaAzerbaijanBahamas, TheBahrainBangladeshBarbadosBelarusBelgiumBelizeBeninBermudaBhutanBoliviaBosnia and HerzegovinaBotswanaBrazilBrunei DarussalamBulgariaBurkina FasoBurundiCabo VerdeCambodiaCameroonCanadaCaribbean small statesCentral African RepublicCentral Europe and the BalticsChadChileChinaColombiaComorosCongo, Dem. Rep.Congo, Rep.Costa RicaCote d'IvoireCroatiaCubaCyprusCzech RepublicDenmarkDjiboutiDominicaDominican RepublicEarly-demographic dividendEast Asia & PacificEast Asia & Pacific (excluding high income)East Asia & Pacific (IDA & IBRD countries)EcuadorEgypt, Arab Rep.El SalvadorEquatorial GuineaEritreaEstoniaEthiopiaEuro areaEurope & Central AsiaEurope & Central Asia (excluding high income)Europe & Central Asia (IDA & IBRD countries)European UnionFaroe IslandsFijiFinlandFragile and conflict affected situationsFranceFrench PolynesiaGabonGambia, TheGeorgiaGermanyGhanaGreeceGrenadaGuatemalaGuineaGuinea-BissauGuyanaHaitiHeavily indebted poor countries (HIPC)High incomeHondurasHong Kong SAR, ChinaHungaryIBRD onlyIcelandIDA & IBRD totalIDA blendIDA onlyIDA totalIndiaIndonesiaIran, Islamic Rep.IraqIrelandIsraelItalyJamaicaJapanJordanKazakhstanKenyaKiribatiKorea, Rep.KosovoKuwaitKyrgyz RepublicLao PDRLate-demographic dividendLatin America & Caribbean Latin America & Caribbean (excluding high income)Latin America & the Caribbean (IDA & IBRD countries)LatviaLeast developed countries: UN classificationLebanonLesothoLiberiaLibyaLithuaniaLow & middle incomeLow incomeLower middle incomeLuxembourgMacao SAR, ChinaMacedonia, FYRMadagascarMalawiMalaysiaMaldivesMaliMaltaMauritaniaMauritiusMexicoMicronesia, Fed. Sts.Middle East & North AfricaMiddle East & North Africa (excluding high income)Middle East & North Africa (IDA & IBRD countries)Middle incomeMoldovaMongoliaMontenegroMoroccoMozambiqueMyanmarNamibiaNepalNetherlandsNew CaledoniaNew ZealandNicaraguaNigerNigeriaNorth AmericaNorwayOECD membersOmanOther small statesPacific island small statesPakistanPalauPanamaPapua New GuineaParaguayPeruPhilippinesPolandPortugalPost-demographic dividendPre-demographic dividendPuerto RicoQatarRomaniaRussian FederationRwandaSamoaSaudi ArabiaSenegalSerbiaSeychellesSierra LeoneSingaporeSlovak RepublicSloveniaSmall statesSolomon IslandsSomaliaSouth AfricaSouth AsiaSouth Asia (IDA & IBRD)South SudanSpainSri LankaSt. Kitts and NevisSt. LuciaSt. Vincent and the GrenadinesSub-Saharan Africa Sub-Saharan Africa (excluding high income)Sub-Saharan Africa (IDA & IBRD countries)SudanSurinameSwazilandSwedenSwitzerlandSyrian Arab RepublicTajikistanTanzaniaThailandTimor-LesteTogoTongaTrinidad and TobagoTunisiaTurkeyTurkmenistanUgandaUkraineUnited Arab EmiratesUnited KingdomUnited StatesUpper middle incomeUruguayUzbekistanVanuatuVenezuela, RBVietnamWest Bank and GazaWorldYemen, Rep.ZambiaZimbabwe Linha do tempo:
Nesta escala de tempo está apresentado um gráfico de 1961 ano até 2016 ano Sweden. Dados de 1960 ano ausente. O número de observações reais por data: 56.
Fonte (nome):
Indicadores de desenvolvimento mundial
Fonte (organização):
World Bank national accounts data, and OECD National Accounts data files.
Categorias:
Economy & Growth, Trade
Foi atualizado:
23 abr 2017 ano
Indicadores de alterações dos valores ao longo dos anos
Mínimo:
-0.978
1 jan 1981 ano
Na data de observação
Valor
Mudança absoluta
A alteração em relação ao valor anterior
1 jan 1961 ano
-0.425
-0.425
0.0%
1 jan 1962 ano
0.652
+1.077
-253.23%
1 jan 1963 ano
0.512
-0.139
-21.38%
1 jan 1964 ano
0.424
-0.089
-17.29%
1 jan 1965 ano
0.43
+0.006
1.51%
1 jan 1966 ano
-0.687
-1.117
-259.77%
1 jan 1967 ano
-0.519
+0.169
-24.52%
1 jan 1968 ano
0.114
+0.633
-121.94%
1 jan 1969 ano
-0.019
-0.133
-117.0%
1 jan 1970 ano
-0.197
-0.177
917.21%
1 jan 1971 ano
0.089
+0.286
-145.09%
1 jan 1972 ano
1.664
+1.575
1.77 mil%
1 jan 1973 ano
1.993
+0.329
19.77%
1 jan 1974 ano
3.217
+1.224
61.43%
1 jan 1975 ano
0.12
-3.097
-96.26%
1 jan 1976 ano
0.533
+0.413
343.46%
1 jan 1977 ano
-0.835
-1.368
-256.69%
1 jan 1978 ano
-0.826
+0.009
-1.07%
1 jan 1979 ano
1.654
+2.48
-300.24%
1 jan 1980 ano
-0.149
-1.803
-109.03%
1 jan 1981 ano
-0.978
-0.829
554.96%
1 jan 1982 ano
0.533
+1.511
-154.53%
1 jan 1983 ano
0.222
-0.312
-58.43%
1 jan 1984 ano
2.557
+2.335
1.05 mil%
1 jan 1985 ano
3.959
+1.402
54.85%
1 jan 1986 ano
2.052
-1.907
-48.17%
1 jan 1987 ano
3.403
+1.351
65.84%
1 jan 1988 ano
2.167
-1.236
-36.33%
1 jan 1989 ano
1.937
-0.23
-10.61%
1 jan 1990 ano
0.778
-1.159
-59.84%
1 jan 1991 ano
0.635
-0.143
-18.35%
1 jan 1992 ano
1.682
+1.047
164.77%
1 jan 1993 ano
1.722
+0.041
2.42%
1 jan 1994 ano
3.374
+1.652
95.91%
1 jan 1995 ano
4.054
+0.68
20.15%
1 jan 1996 ano
6.379
+2.324
57.33%
1 jan 1997 ano
6.178
-0.201
-3.15%
1 jan 1998 ano
6.949
+0.771
12.48%
1 jan 1999 ano
6.311
-0.638
-9.19%
1 jan 2000 ano
6.066
-0.244
-3.87%
1 jan 2001 ano
5.868
-0.198
-3.26%
1 jan 2002 ano
6.232
+0.363
6.19%
1 jan 2003 ano
6.317
+0.085
1.36%
1 jan 2004 ano
6.34
+0.024
0.38%
1 jan 2005 ano
7.6
+1.26
19.86%
1 jan 2006 ano
7.173
-0.427
-5.62%
1 jan 2007 ano
7.591
+0.418
5.83%
1 jan 2008 ano
6.976
-0.614
-8.09%
1 jan 2009 ano
6.267
-0.709
-10.17%
1 jan 2010 ano
5.761
-0.506
-8.07%
1 jan 2011 ano
5.468
-0.294
-5.1%
1 jan 2012 ano
4.704
-0.763
-13.96%
1 jan 2013 ano
4.931
+0.227
4.83%
1 jan 2014 ano
4.508
-0.424
-8.59%
1 jan 2015 ano
4.316
-0.192
-4.26%
1 jan 2016 ano
4.747
+0.432
10.0%
Classificação de países por estatísticas atuais por anos


Comentários: