29
/pt/
pt
AIzaSyAYiBZKx7MnpbEhh9jyipgxe19OcubqV5w
April 1, 2024
135459
Gabon
GAB
true
2
1
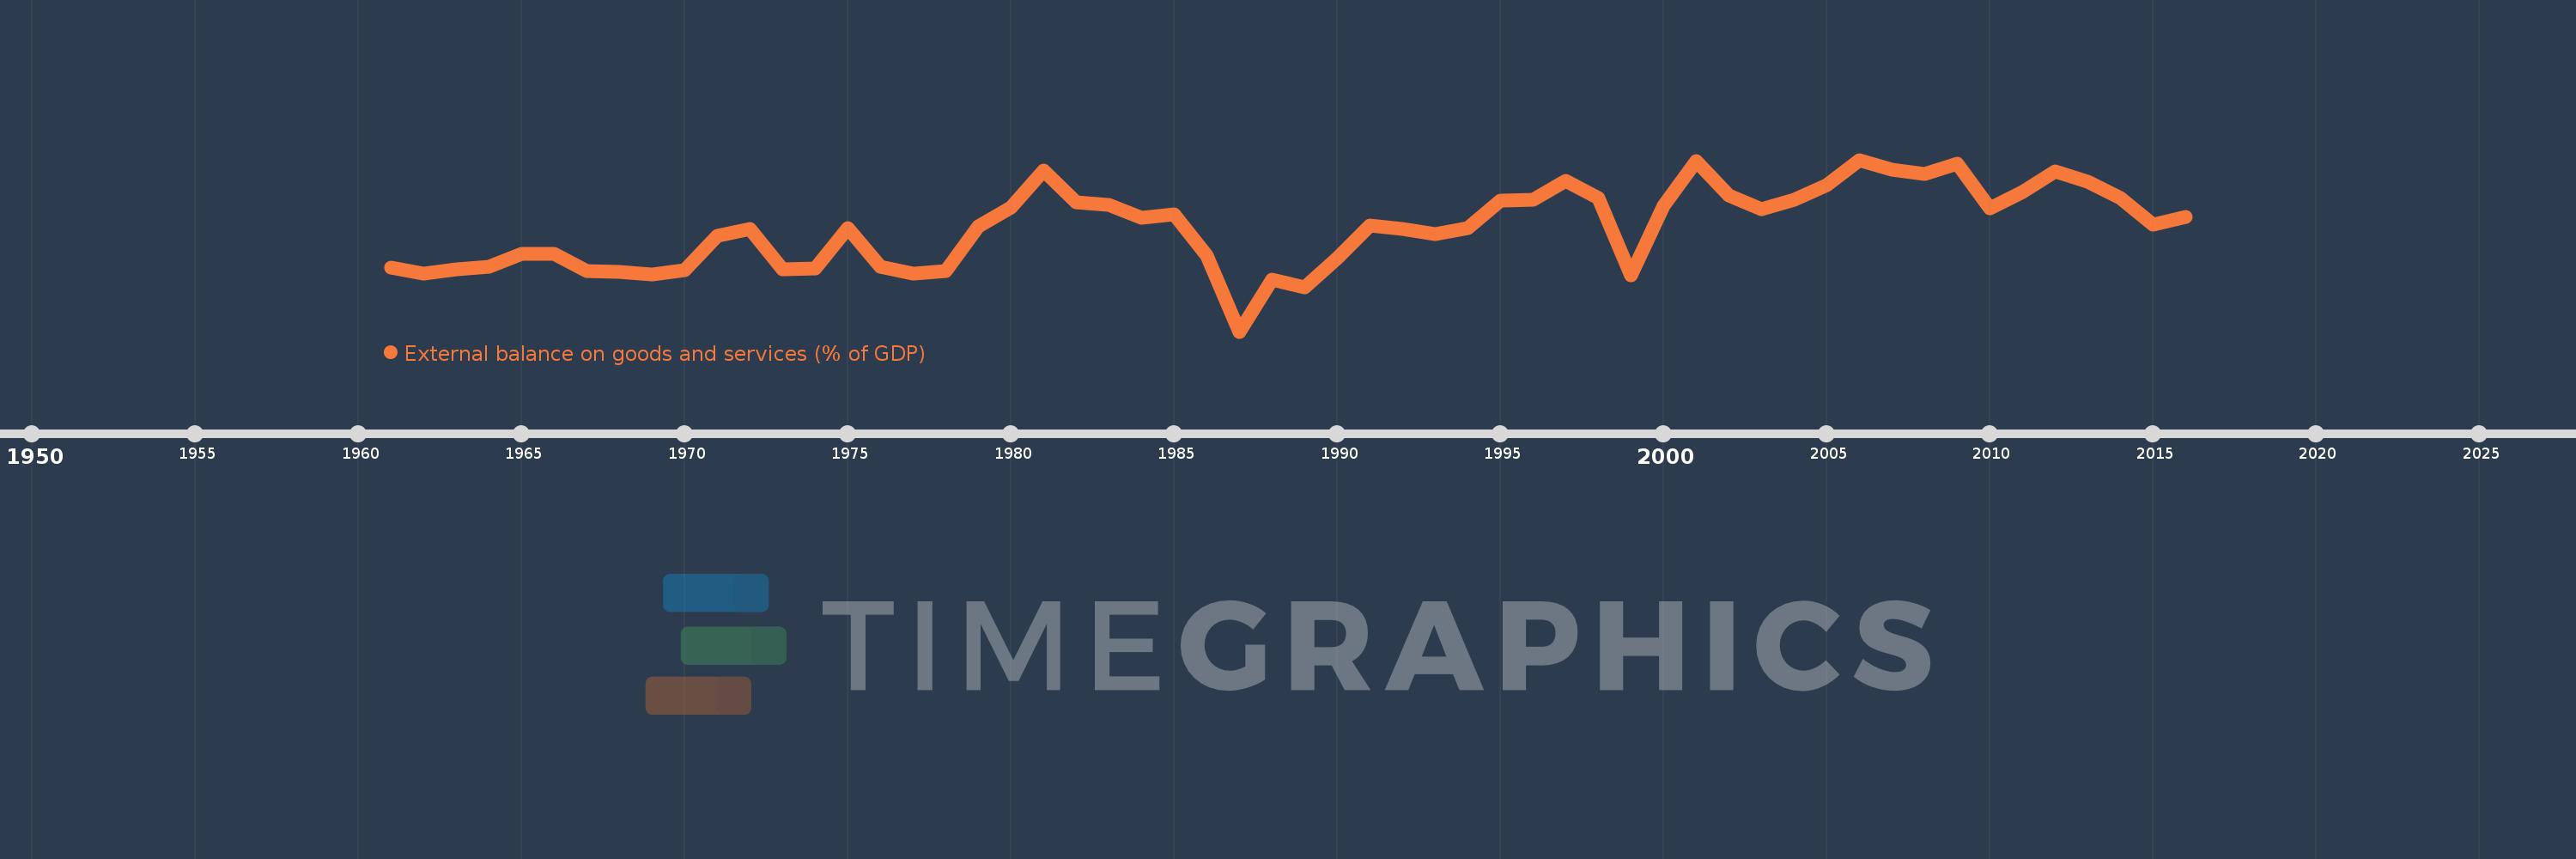
External balance on goods and services (% of GDP)
2016,2015,2014,2013,2012,2011,2010,2009,2008,2007,2006,2005,2004,2003,2002,2001,2000,1999,1998,1997,1996,1995,1994,1993,1992,1991,1990,1989,1988,1987,1986,1985,1984,1983,1982,1981,1980,1979,1978,1977,1976,1975,1974,1973,1972,1971,1970,1969,1968,1967,1966,1965,1964,1963,1962,1961
Estas estatísticas em outros países:
AfghanistanAlbaniaAlgeriaAngolaAntigua and BarbudaArab WorldArgentinaArmeniaArubaAustraliaAustriaAzerbaijanBahamas, TheBahrainBangladeshBarbadosBelarusBelgiumBelizeBeninBermudaBhutanBoliviaBosnia and HerzegovinaBotswanaBrazilBrunei DarussalamBulgariaBurkina FasoBurundiCabo VerdeCambodiaCameroonCanadaCaribbean small statesCentral African RepublicCentral Europe and the BalticsChadChileChinaColombiaComorosCongo, Dem. Rep.Congo, Rep.Costa RicaCote d'IvoireCroatiaCubaCyprusCzech RepublicDenmarkDjiboutiDominicaDominican RepublicEarly-demographic dividendEast Asia & PacificEast Asia & Pacific (excluding high income)East Asia & Pacific (IDA & IBRD countries)EcuadorEgypt, Arab Rep.El SalvadorEquatorial GuineaEritreaEstoniaEthiopiaEuro areaEurope & Central AsiaEurope & Central Asia (excluding high income)Europe & Central Asia (IDA & IBRD countries)European UnionFaroe IslandsFijiFinlandFragile and conflict affected situationsFranceFrench PolynesiaGabonGambia, TheGeorgiaGermanyGhanaGreeceGrenadaGuatemalaGuineaGuinea-BissauGuyanaHaitiHeavily indebted poor countries (HIPC)High incomeHondurasHong Kong SAR, ChinaHungaryIBRD onlyIcelandIDA & IBRD totalIDA blendIDA onlyIDA totalIndiaIndonesiaIran, Islamic Rep.IraqIrelandIsraelItalyJamaicaJapanJordanKazakhstanKenyaKiribatiKorea, Rep.KosovoKuwaitKyrgyz RepublicLao PDRLate-demographic dividendLatin America & Caribbean Latin America & Caribbean (excluding high income)Latin America & the Caribbean (IDA & IBRD countries)LatviaLeast developed countries: UN classificationLebanonLesothoLiberiaLibyaLithuaniaLow & middle incomeLow incomeLower middle incomeLuxembourgMacao SAR, ChinaMacedonia, FYRMadagascarMalawiMalaysiaMaldivesMaliMaltaMauritaniaMauritiusMexicoMicronesia, Fed. Sts.Middle East & North AfricaMiddle East & North Africa (excluding high income)Middle East & North Africa (IDA & IBRD countries)Middle incomeMoldovaMongoliaMontenegroMoroccoMozambiqueMyanmarNamibiaNepalNetherlandsNew CaledoniaNew ZealandNicaraguaNigerNigeriaNorth AmericaNorwayOECD membersOmanOther small statesPacific island small statesPakistanPalauPanamaPapua New GuineaParaguayPeruPhilippinesPolandPortugalPost-demographic dividendPre-demographic dividendPuerto RicoQatarRomaniaRussian FederationRwandaSamoaSaudi ArabiaSenegalSerbiaSeychellesSierra LeoneSingaporeSlovak RepublicSloveniaSmall statesSolomon IslandsSomaliaSouth AfricaSouth AsiaSouth Asia (IDA & IBRD)South SudanSpainSri LankaSt. Kitts and NevisSt. LuciaSt. Vincent and the GrenadinesSub-Saharan Africa Sub-Saharan Africa (excluding high income)Sub-Saharan Africa (IDA & IBRD countries)SudanSurinameSwazilandSwedenSwitzerlandSyrian Arab RepublicTajikistanTanzaniaThailandTimor-LesteTogoTongaTrinidad and TobagoTunisiaTurkeyTurkmenistanUgandaUkraineUnited Arab EmiratesUnited KingdomUnited StatesUpper middle incomeUruguayUzbekistanVanuatuVenezuela, RBVietnamWest Bank and GazaWorldYemen, Rep.ZambiaZimbabwe Linha do tempo:
Nesta escala de tempo está apresentado um gráfico de 1961 ano até 2016 ano Gabon. Dados de 1960 ano ausente. O número de observações reais por data: 56.
Fonte (nome):
Indicadores de desenvolvimento mundial
Fonte (organização):
World Bank national accounts data, and OECD National Accounts data files.
Categorias:
Economy & Growth, Trade
Foi atualizado:
23 abr 2017 ano
Indicadores de alterações dos valores ao longo dos anos
Mínimo:
-19.513
1 jan 1987 ano
Máximo:
36.655
1 jan 2006 ano
Na data de observação
Valor
Mudança absoluta
A alteração em relação ao valor anterior
1 jan 1961 ano
1.544
+1.544
0.0%
1 jan 1962 ano
-0.451
-1.995
-129.22%
1 jan 1963 ano
0.946
+1.397
-309.67%
1 jan 1964 ano
1.709
+0.763
80.72%
1 jan 1965 ano
5.94
+4.231
247.53%
1 jan 1966 ano
5.946
+0.006
0.09%
1 jan 1967 ano
0.166
-5.78
-97.22%
1 jan 1968 ano
0.0
-0.166
-100.0%
1 jan 1969 ano
-0.823
-0.823
%
1 jan 1970 ano
0.605
+1.428
-173.46%
1 jan 1971 ano
11.732
+11.127
1.84 mil%
1 jan 1972 ano
13.987
+2.255
19.22%
1 jan 1973 ano
0.83
-13.157
-94.07%
1 jan 1974 ano
1.179
+0.35
42.17%
1 jan 1975 ano
14.286
+13.106
1.11 mil%
1 jan 1976 ano
1.622
-12.664
-88.65%
1 jan 1977 ano
-0.515
-2.137
-131.72%
1 jan 1978 ano
0.333
+0.848
-164.77%
1 jan 1979 ano
14.837
+14.504
4.35 mil%
1 jan 1980 ano
21.083
+6.246
42.1%
1 jan 1981 ano
33.09
+12.007
56.95%
1 jan 1982 ano
22.668
-10.422
-31.5%
1 jan 1983 ano
21.928
-0.74
-3.26%
1 jan 1984 ano
17.782
-4.146
-18.91%
1 jan 1985 ano
18.892
+1.11
6.24%
1 jan 1986 ano
5.292
-13.601
-71.99%
1 jan 1987 ano
-19.513
-24.805
-468.76%
1 jan 1988 ano
-2.525
+16.988
-87.06%
1 jan 1989 ano
-5.061
-2.536
100.46%
1 jan 1990 ano
4.598
+9.658
-190.84%
1 jan 1991 ano
15.18
+10.582
230.17%
1 jan 1992 ano
13.992
-1.188
-7.82%
1 jan 1993 ano
12.282
-1.71
-12.22%
1 jan 1994 ano
14.246
+1.964
15.99%
1 jan 1995 ano
23.425
+9.178
64.43%
1 jan 1996 ano
23.639
+0.215
0.92%
1 jan 1997 ano
29.656
+6.016
25.45%
1 jan 1998 ano
24.072
-5.584
-18.83%
1 jan 1999 ano
-1.162
-25.234
-104.83%
1 jan 2000 ano
21.494
+22.656
-1.95 mil%
1 jan 2001 ano
36.362
+14.869
69.18%
1 jan 2002 ano
24.912
-11.451
-31.49%
1 jan 2003 ano
20.459
-4.453
-17.88%
1 jan 2004 ano
23.556
+3.098
15.14%
1 jan 2005 ano
28.311
+4.755
20.18%
1 jan 2006 ano
36.655
+8.344
29.47%
1 jan 2007 ano
33.438
-3.217
-8.78%
1 jan 2008 ano
31.925
-1.513
-4.52%
1 jan 2009 ano
35.401
+3.476
10.89%
1 jan 2010 ano
20.839
-14.562
-41.13%
1 jan 2011 ano
26.169
+5.33
25.58%
1 jan 2012 ano
32.99
+6.821
26.07%
1 jan 2013 ano
29.558
-3.432
-10.4%
1 jan 2014 ano
24.08
-5.478
-18.53%
1 jan 2015 ano
15.521
-8.558
-35.54%
1 jan 2016 ano
17.87
+2.349
15.13%
Classificação de países por estatísticas atuais por anos


Comentários: