29
/pt/
pt
AIzaSyAYiBZKx7MnpbEhh9jyipgxe19OcubqV5w
April 1, 2024
91919
Brazil
BRA
true
2
1
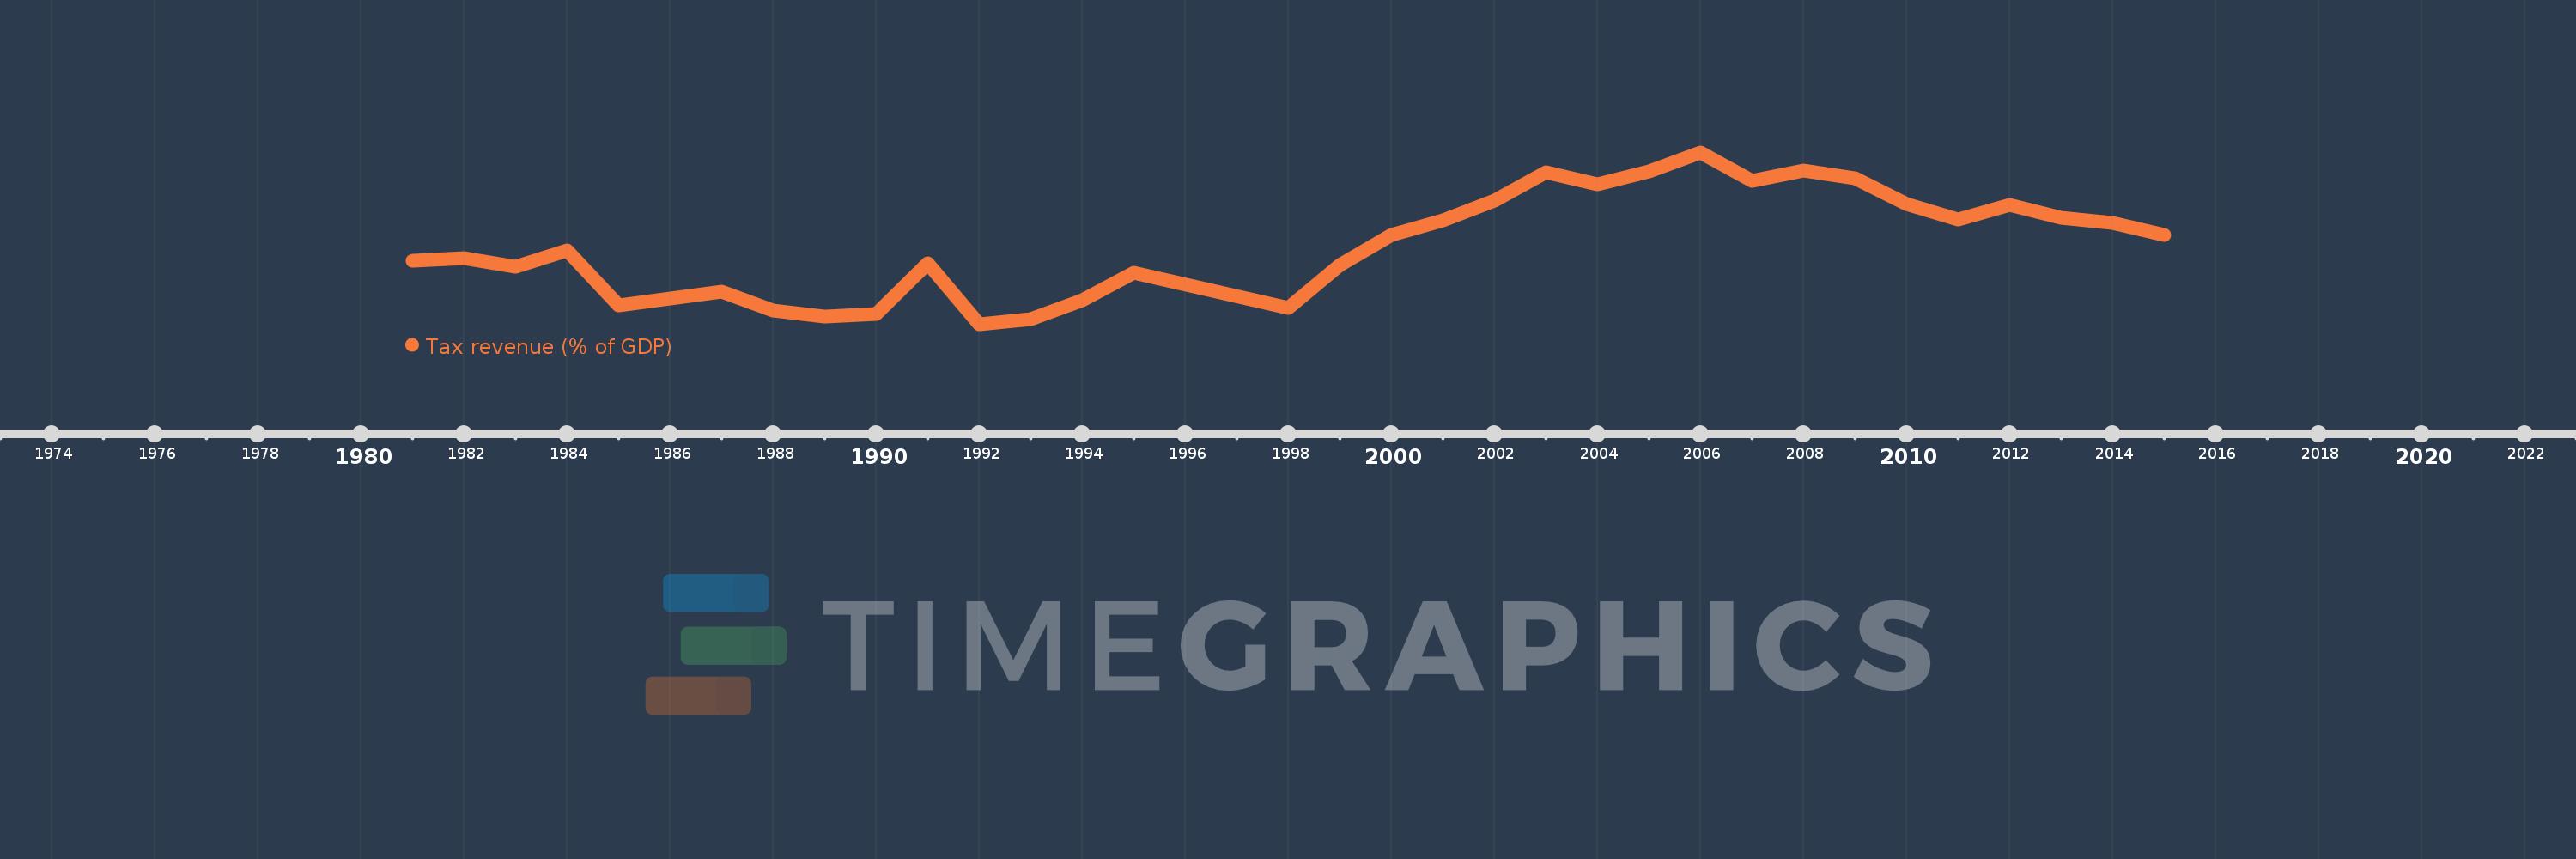
Tax revenue (% of GDP)
2015,2014,2013,2012,2011,2010,2009,2008,2007,2006,2005,2004,2003,2002,2001,2000,1999,1998,1995,1994,1993,1992,1991,1990,1989,1988,1987,1986,1985,1984,1983,1982,1981
Estas estatísticas em outros países:
AfghanistanAlbaniaAlgeriaAngolaAntigua and BarbudaArgentinaArmeniaAustraliaAustriaAzerbaijanBahamas, TheBahrainBangladeshBarbadosBelarusBelgiumBelizeBeninBhutanBoliviaBosnia and HerzegovinaBotswanaBrazilBulgariaBurkina FasoBurundiCabo VerdeCambodiaCanadaCaribbean small statesCentral African RepublicCentral Europe and the BalticsChileChinaColombiaCongo, Dem. Rep.Congo, Rep.Costa RicaCote d'IvoireCroatiaCyprusCzech RepublicDenmarkDominicaDominican RepublicEarly-demographic dividendEast Asia & PacificEast Asia & Pacific (excluding high income)East Asia & Pacific (IDA & IBRD countries)Egypt, Arab Rep.El SalvadorEquatorial GuineaEstoniaEthiopiaEuro areaEurope & Central AsiaEurope & Central Asia (excluding high income)Europe & Central Asia (IDA & IBRD countries)European UnionFijiFinlandFranceGambia, TheGeorgiaGermanyGhanaGreeceGrenadaGuatemalaHeavily indebted poor countries (HIPC)High incomeHondurasHong Kong SAR, ChinaHungaryIBRD onlyIcelandIDA & IBRD totalIDA blendIDA onlyIDA totalIndiaIndonesiaIran, Islamic Rep.IraqIrelandIsraelItalyJamaicaJapanJordanKazakhstanKenyaKiribatiKorea, Rep.KuwaitKyrgyz RepublicLao PDRLate-demographic dividendLatin America & Caribbean Latin America & Caribbean (excluding high income)Latin America & the Caribbean (IDA & IBRD countries)LatviaLeast developed countries: UN classificationLebanonLesothoLiberiaLithuaniaLow & middle incomeLow incomeLower middle incomeLuxembourgMacao SAR, ChinaMacedonia, FYRMadagascarMalawiMalaysiaMaldivesMaliMaltaMauritiusMexicoMicronesia, Fed. Sts.Middle East & North Africa (excluding high income)Middle East & North Africa (IDA & IBRD countries)Middle incomeMoldovaMongoliaMoroccoMozambiqueMyanmarNamibiaNepalNetherlandsNew ZealandNicaraguaNigeriaNorth AmericaNorwayOECD membersOmanOther small statesPacific island small statesPakistanPanamaPapua New GuineaParaguayPeruPhilippinesPolandPortugalPost-demographic dividendPre-demographic dividendQatarRomaniaRussian FederationRwandaSamoaSan MarinoSao Tome and PrincipeSenegalSerbiaSeychellesSierra LeoneSingaporeSlovak RepublicSloveniaSmall statesSolomon IslandsSouth AfricaSouth AsiaSouth Asia (IDA & IBRD)SpainSri LankaSt. Kitts and NevisSt. LuciaSt. Vincent and the GrenadinesSub-Saharan Africa Sub-Saharan Africa (excluding high income)Sub-Saharan Africa (IDA & IBRD countries)SurinameSwazilandSwedenSwitzerlandSyrian Arab RepublicTajikistanTanzaniaThailandTimor-LesteTogoTrinidad and TobagoTunisiaTurkeyUgandaUkraineUnited Arab EmiratesUnited KingdomUnited StatesUpper middle incomeUruguayVanuatuVenezuela, RBVietnamWest Bank and GazaWorldYemen, Rep.ZambiaZimbabwe Linha do tempo:
Nesta escala de tempo está apresentado um gráfico de 1981 ano até 2015 ano Brazil. Dados de 1980 ano ausente. O número de observações reais por data: 33.
Fonte (nome):
Indicadores de desenvolvimento mundial
Fonte (organização):
International Monetary Fund, Government Finance Statistics Yearbook and data files, and World Bank and OECD GDP estimates.
Categorias:
Public Sector
Foi atualizado:
23 abr 2017 ano
Indicadores de alterações dos valores ao longo dos anos
Mínimo:
9.53
1 jan 1992 ano
Máximo:
16.529
1 jan 2006 ano
Na data de observação
Valor
Mudança absoluta
A alteração em relação ao valor anterior
1 jan 1981 ano
12.113
+12.113
0.0%
1 jan 1982 ano
12.229
+0.116
0.95%
1 jan 1983 ano
11.872
-0.357
-2.92%
1 jan 1984 ano
12.536
+0.665
5.6%
1 jan 1985 ano
10.308
-2.228
-17.77%
1 jan 1986 ano
10.568
+0.259
2.51%
1 jan 1987 ano
10.839
+0.271
2.57%
1 jan 1988 ano
10.097
-0.741
-6.84%
1 jan 1989 ano
9.83
-0.267
-2.65%
1 jan 1990 ano
9.931
+0.101
1.02%
1 jan 1991 ano
12.009
+2.078
20.93%
1 jan 1992 ano
9.53
-2.479
-20.65%
1 jan 1993 ano
9.734
+0.204
2.14%
1 jan 1994 ano
10.5
+0.766
7.87%
1 jan 1995 ano
11.643
+1.143
10.88%
1 jan 1998 ano
10.196
-1.447
-12.43%
1 jan 1999 ano
11.952
+1.757
17.23%
1 jan 2000 ano
13.168
+1.215
10.17%
1 jan 2001 ano
13.775
+0.607
4.61%
1 jan 2002 ano
14.56
+0.785
5.7%
1 jan 2003 ano
15.72
+1.16
7.97%
1 jan 2004 ano
15.244
-0.476
-3.03%
1 jan 2005 ano
15.753
+0.508
3.34%
1 jan 2006 ano
16.529
+0.776
4.93%
1 jan 2007 ano
15.381
-1.148
-6.94%
1 jan 2008 ano
15.776
+0.394
2.56%
1 jan 2009 ano
15.493
-0.283
-1.79%
1 jan 2010 ano
14.418
-1.075
-6.94%
1 jan 2011 ano
13.786
-0.631
-4.38%
1 jan 2012 ano
14.399
+0.612
4.44%
1 jan 2013 ano
13.85
-0.548
-3.81%
1 jan 2014 ano
13.654
-0.196
-1.42%
1 jan 2015 ano
13.149
-0.505
-3.7%
Classificação de países por estatísticas atuais por anos


Comentários: