29
/pt/
pt
AIzaSyAYiBZKx7MnpbEhh9jyipgxe19OcubqV5w
April 1, 2024
278315
Uruguay
URY
true
2
1
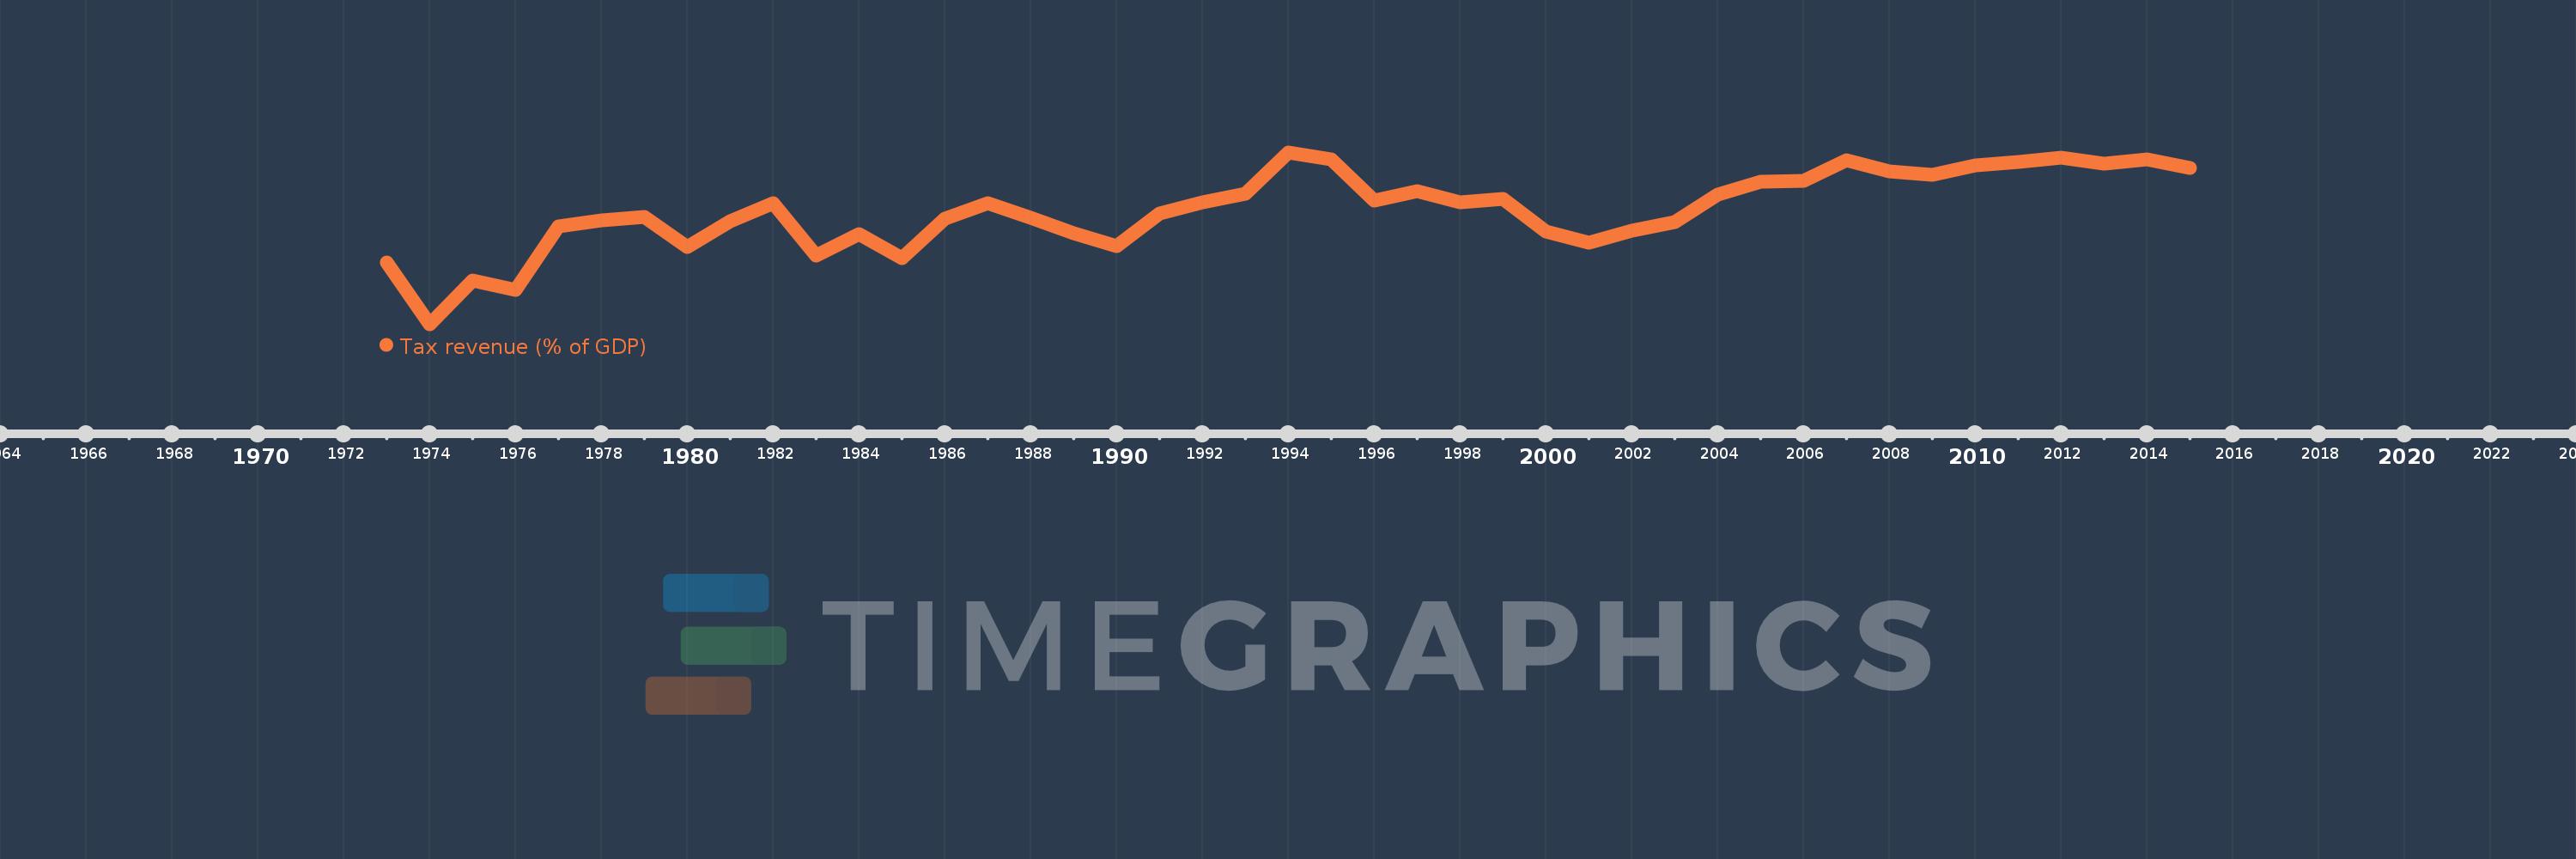
Tax revenue (% of GDP)
2015,2014,2013,2012,2011,2010,2009,2008,2007,2006,2005,2004,2003,2002,2001,2000,1999,1998,1997,1996,1995,1994,1993,1992,1991,1990,1989,1988,1987,1986,1985,1984,1983,1982,1981,1980,1979,1978,1977,1976,1975,1974,1973
Estas estatísticas em outros países:
AfghanistanAlbaniaAlgeriaAngolaAntigua and BarbudaArgentinaArmeniaAustraliaAustriaAzerbaijanBahamas, TheBahrainBangladeshBarbadosBelarusBelgiumBelizeBeninBhutanBoliviaBosnia and HerzegovinaBotswanaBrazilBulgariaBurkina FasoBurundiCabo VerdeCambodiaCanadaCaribbean small statesCentral African RepublicCentral Europe and the BalticsChileChinaColombiaCongo, Dem. Rep.Congo, Rep.Costa RicaCote d'IvoireCroatiaCyprusCzech RepublicDenmarkDominicaDominican RepublicEarly-demographic dividendEast Asia & PacificEast Asia & Pacific (excluding high income)East Asia & Pacific (IDA & IBRD countries)Egypt, Arab Rep.El SalvadorEquatorial GuineaEstoniaEthiopiaEuro areaEurope & Central AsiaEurope & Central Asia (excluding high income)Europe & Central Asia (IDA & IBRD countries)European UnionFijiFinlandFranceGambia, TheGeorgiaGermanyGhanaGreeceGrenadaGuatemalaHeavily indebted poor countries (HIPC)High incomeHondurasHong Kong SAR, ChinaHungaryIBRD onlyIcelandIDA & IBRD totalIDA blendIDA onlyIDA totalIndiaIndonesiaIran, Islamic Rep.IraqIrelandIsraelItalyJamaicaJapanJordanKazakhstanKenyaKiribatiKorea, Rep.KuwaitKyrgyz RepublicLao PDRLate-demographic dividendLatin America & Caribbean Latin America & Caribbean (excluding high income)Latin America & the Caribbean (IDA & IBRD countries)LatviaLeast developed countries: UN classificationLebanonLesothoLiberiaLithuaniaLow & middle incomeLow incomeLower middle incomeLuxembourgMacao SAR, ChinaMacedonia, FYRMadagascarMalawiMalaysiaMaldivesMaliMaltaMauritiusMexicoMicronesia, Fed. Sts.Middle East & North Africa (excluding high income)Middle East & North Africa (IDA & IBRD countries)Middle incomeMoldovaMongoliaMoroccoMozambiqueMyanmarNamibiaNepalNetherlandsNew ZealandNicaraguaNigeriaNorth AmericaNorwayOECD membersOmanOther small statesPacific island small statesPakistanPanamaPapua New GuineaParaguayPeruPhilippinesPolandPortugalPost-demographic dividendPre-demographic dividendQatarRomaniaRussian FederationRwandaSamoaSan MarinoSao Tome and PrincipeSenegalSerbiaSeychellesSierra LeoneSingaporeSlovak RepublicSloveniaSmall statesSolomon IslandsSouth AfricaSouth AsiaSouth Asia (IDA & IBRD)SpainSri LankaSt. Kitts and NevisSt. LuciaSt. Vincent and the GrenadinesSub-Saharan Africa Sub-Saharan Africa (excluding high income)Sub-Saharan Africa (IDA & IBRD countries)SurinameSwazilandSwedenSwitzerlandSyrian Arab RepublicTajikistanTanzaniaThailandTimor-LesteTogoTrinidad and TobagoTunisiaTurkeyUgandaUkraineUnited Arab EmiratesUnited KingdomUnited StatesUpper middle incomeUruguayVanuatuVenezuela, RBVietnamWest Bank and GazaWorldYemen, Rep.ZambiaZimbabwe Linha do tempo:
Nesta escala de tempo está apresentado um gráfico de 1973 ano até 2015 ano Uruguay. Dados de 1972 ano ausente. O número de observações reais por data: 43.
Fonte (nome):
Indicadores de desenvolvimento mundial
Fonte (organização):
International Monetary Fund, Government Finance Statistics Yearbook and data files, and World Bank and OECD GDP estimates.
Categorias:
Public Sector
Foi atualizado:
23 abr 2017 ano
Indicadores de alterações dos valores ao longo dos anos
Mínimo:
10.447
1 jan 1974 ano
Máximo:
19.389
1 jan 1994 ano
Na data de observação
Valor
Mudança absoluta
A alteração em relação ao valor anterior
1 jan 1973 ano
13.681
+13.681
0.0%
1 jan 1974 ano
10.447
-3.234
-23.64%
1 jan 1975 ano
12.71
+2.263
21.66%
1 jan 1976 ano
12.236
-0.474
-3.73%
1 jan 1977 ano
15.523
+3.287
26.86%
1 jan 1978 ano
15.848
+0.324
2.09%
1 jan 1979 ano
16.023
+0.175
1.11%
1 jan 1980 ano
14.447
-1.576
-9.84%
1 jan 1981 ano
15.826
+1.379
9.54%
1 jan 1982 ano
16.739
+0.913
5.77%
1 jan 1983 ano
14.006
-2.734
-16.33%
1 jan 1984 ano
15.121
+1.116
7.97%
1 jan 1985 ano
13.869
-1.252
-8.28%
1 jan 1986 ano
15.95
+2.08
15.0%
1 jan 1987 ano
16.763
+0.813
5.1%
1 jan 1988 ano
15.965
-0.798
-4.76%
1 jan 1989 ano
15.189
-0.776
-4.86%
1 jan 1990 ano
14.532
-0.657
-4.32%
1 jan 1991 ano
16.203
+1.67
11.49%
1 jan 1992 ano
16.793
+0.591
3.65%
1 jan 1993 ano
17.241
+0.448
2.67%
1 jan 1994 ano
19.389
+2.149
12.46%
1 jan 1995 ano
19.034
-0.355
-1.83%
1 jan 1996 ano
16.879
-2.156
-11.33%
1 jan 1997 ano
17.351
+0.472
2.8%
1 jan 1998 ano
16.781
-0.57
-3.29%
1 jan 1999 ano
16.983
+0.202
1.2%
1 jan 2000 ano
15.278
-1.705
-10.04%
1 jan 2001 ano
14.699
-0.579
-3.79%
1 jan 2002 ano
15.306
+0.607
4.13%
1 jan 2003 ano
15.778
+0.472
3.08%
1 jan 2004 ano
17.206
+1.428
9.05%
1 jan 2005 ano
17.846
+0.64
3.72%
1 jan 2006 ano
17.897
+0.051
0.28%
1 jan 2007 ano
18.988
+1.091
6.1%
1 jan 2008 ano
18.411
-0.578
-3.04%
1 jan 2009 ano
18.242
-0.169
-0.92%
1 jan 2010 ano
18.722
+0.48
2.63%
1 jan 2011 ano
18.886
+0.164
0.88%
1 jan 2012 ano
19.102
+0.215
1.14%
1 jan 2013 ano
18.822
-0.28
-1.47%
1 jan 2014 ano
19.041
+0.22
1.17%
1 jan 2015 ano
18.567
-0.475
-2.49%
Classificação de países por estatísticas atuais por anos


Comentários: